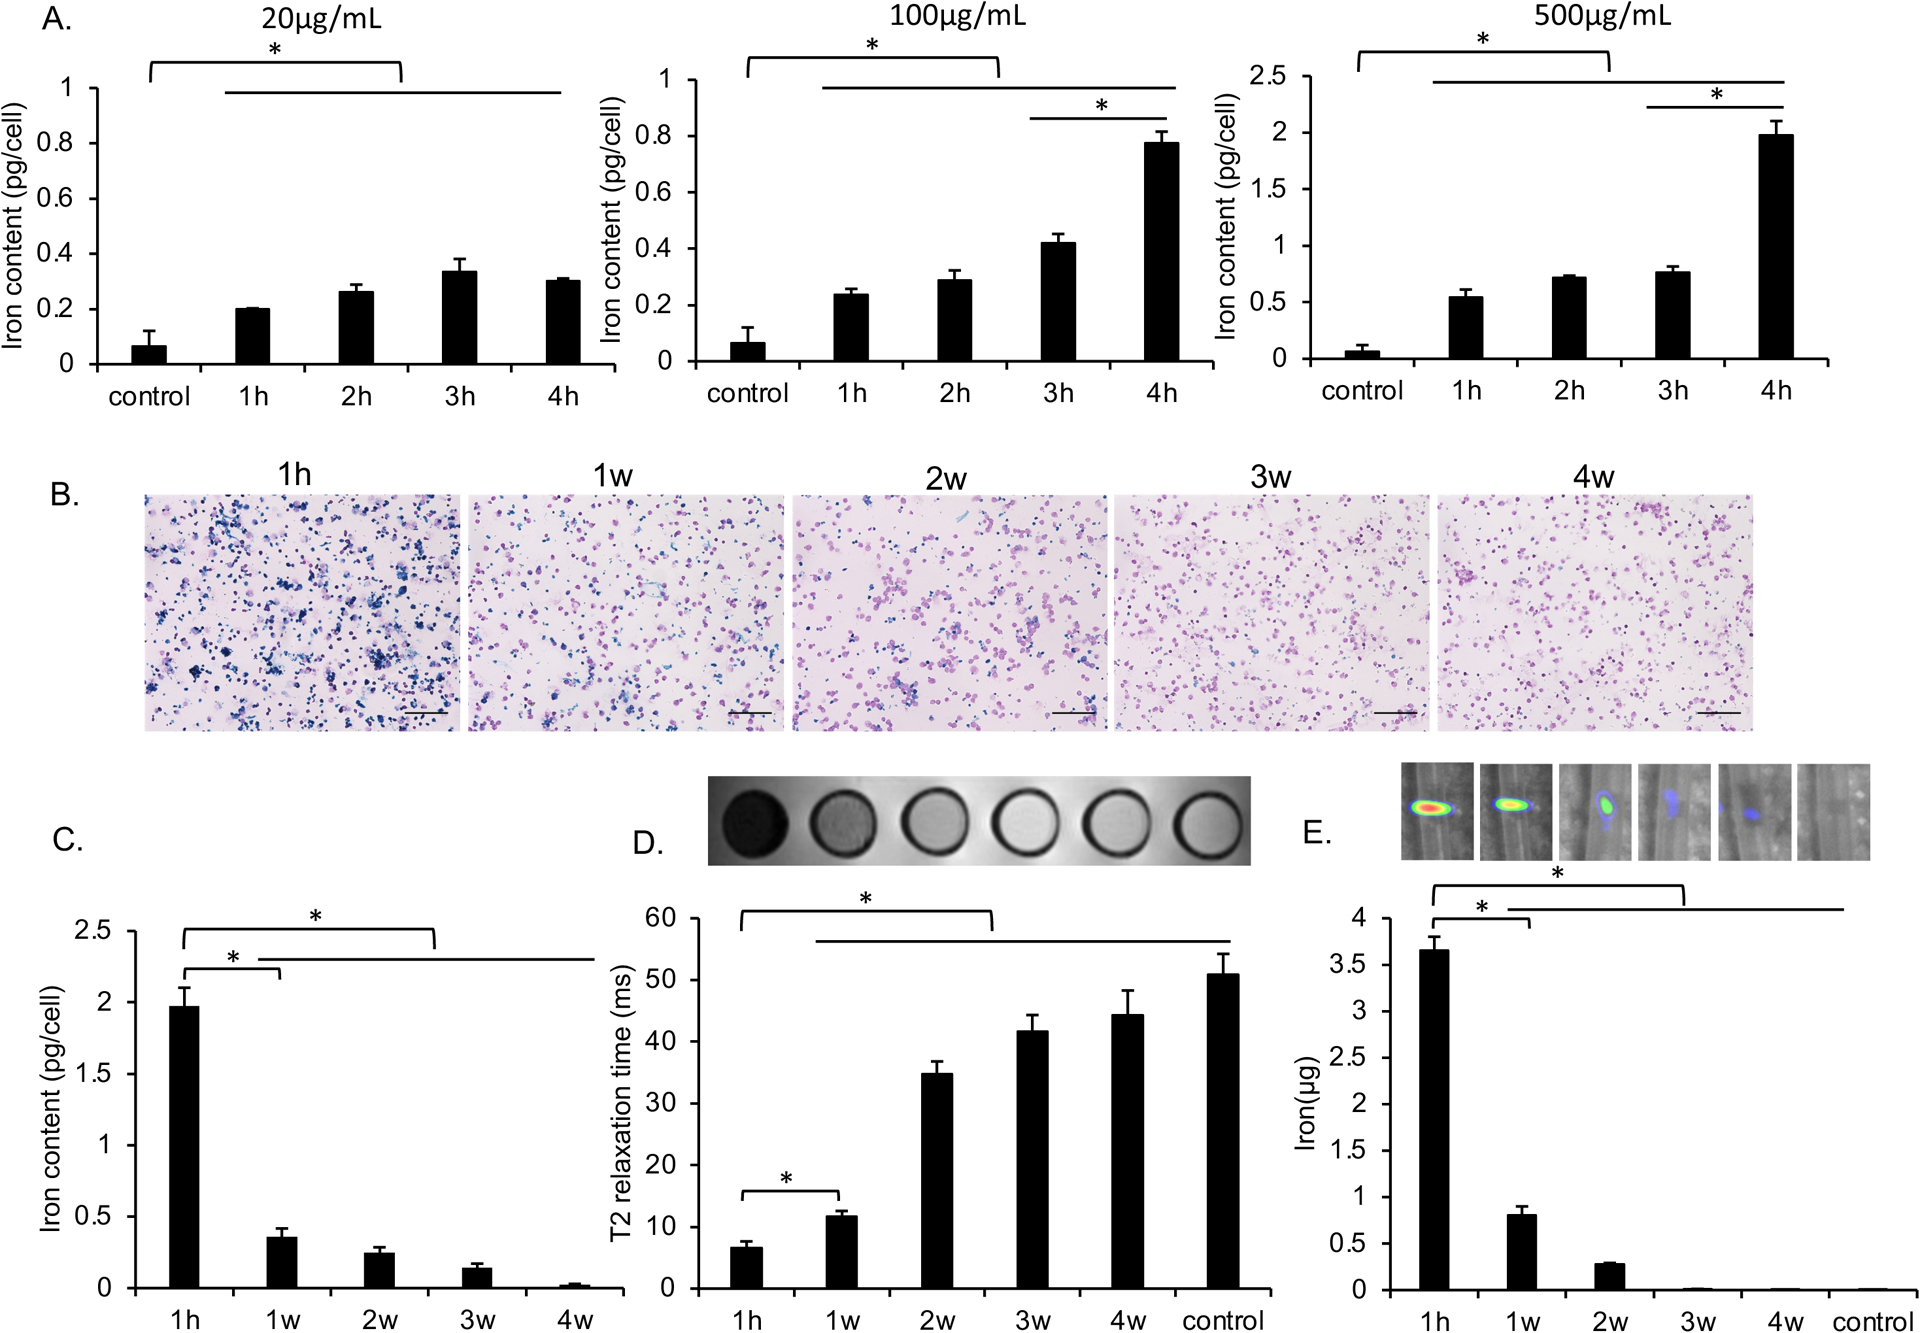
Figure 2. Evaluating the in vitro uptake of MegaPro-NP by CAR T-cells.

(A) Intracellular iron content of CAR T-cells, as determined by inductively coupled plasma optical emission spectroscopy (ICP-OES) after incubation with increasing concentrations of MegaPro-NP for increasing time periods. Data are displayed as means and standard deviations of triplicate experiments for each group. (B) Representative prussian blue stains of CAR T-cells at 1 hour as well as 1, 2, 3 and 4 weeks after labeling with MegaPro-NP at a concentration of 500 μg/mL for 4h. (scale bars, 100 μm) C) Corresponding intracellular iron content of CAR T-cells, as determined by ICP-OES. (D) Corresponding axial T2-weighted MRI images and T2* relaxation times of 2 million CAR T-cells at different time points after labeling with MegaPro-NP at a concentration of 500 μg/mL for 4 hours. (E) Corresponding MPI images of 2 million CAR T-cells at different time points after labeling with MegaPro-NP at a concentration of 500 μg/mL for 4 hours. The Kruskal–Wallis test was used to test the statistical difference among different time points, a p < 0.05 was considered statistically significant. The Kruskal-Wallis test was conducted to evaluate the overall group difference, and if any group difference was detected (p<0.05), then the Mann-Whitney U test was applied to compare the pairs of groups. A value of p < 0.01 was considered statistically significant and denoted with an asterisk.
