
Figure 6. Histology demonstrated the accumulation of MegaPro labeled CAR T-cells in GBM.
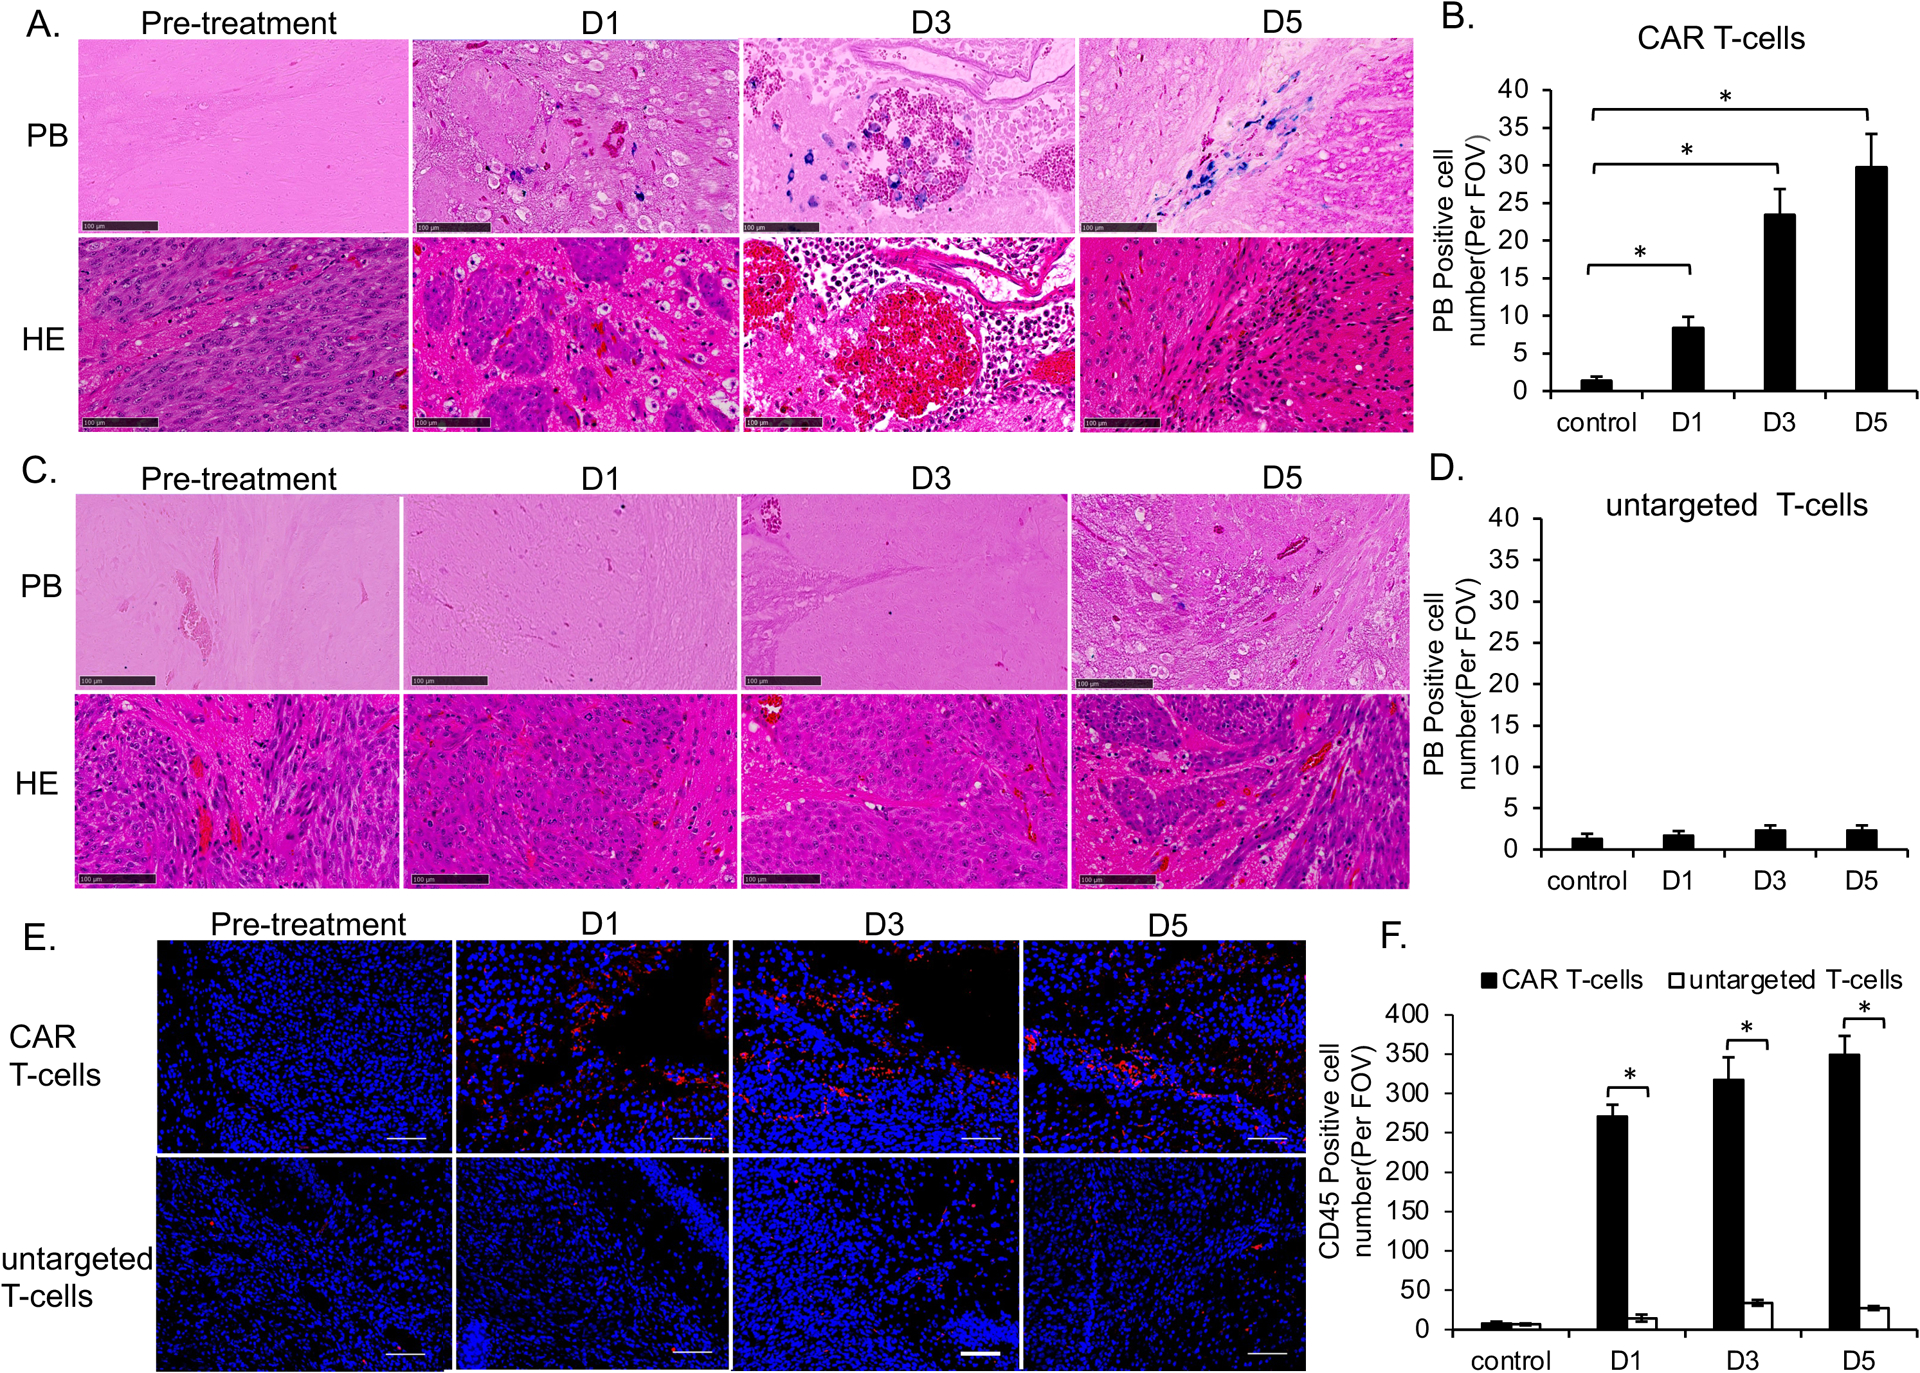
(A) Tumor specimen before and after treatment with MegaPro-NP-labeled CAR T-cells. Prussian blue staining (upper row) showed iron containing cells. Hematoxylin and eosin (H&E) staining (lower row) showed the tumor morphology and vascular niches (scale bars, 100 μm). (B) Corresponding quantitative data show increasing quantities of prussian-blue positive cells with increasing time after infusion of MegaPro-NP-labeled CAR T-cells. (C) Tumor specimen before and after treatment with MegaPro-NP-labeled untargeted T-cells. Prussian blue staining (upper row) showed no iron containing cells. Hematoxylin and eosin (H&E) staining (lower row) showed the tumor morphology (scale bars, 100 μm). (D) Corresponding quantitative data show few prussian-blue positive cells. (E) CD45 immunostaining of representative brain tumors at different time points before and after infusion of either MegaPro-NP-labeled CAR T-cells (upper row) or MegaPro-NP-labeled untargeted T-cells (lower row). (F) Corresponding quantitative data show significantly more CD45 positive cells (red) in tumors treated with MegaPro-NP-labeled CAR T-cells than MegaPro-NP-labeled untargeted T-cells (scale bars, 100 μm). The Kruskal-Wallis test was conducted to evaluate the overall group difference, and if any group difference was detected (p<0.05), then the Mann-Whitney U test was applied to compare the pairs of groups. A value of p < 0.01 was considered statistically significant and denoted with an asterisk.