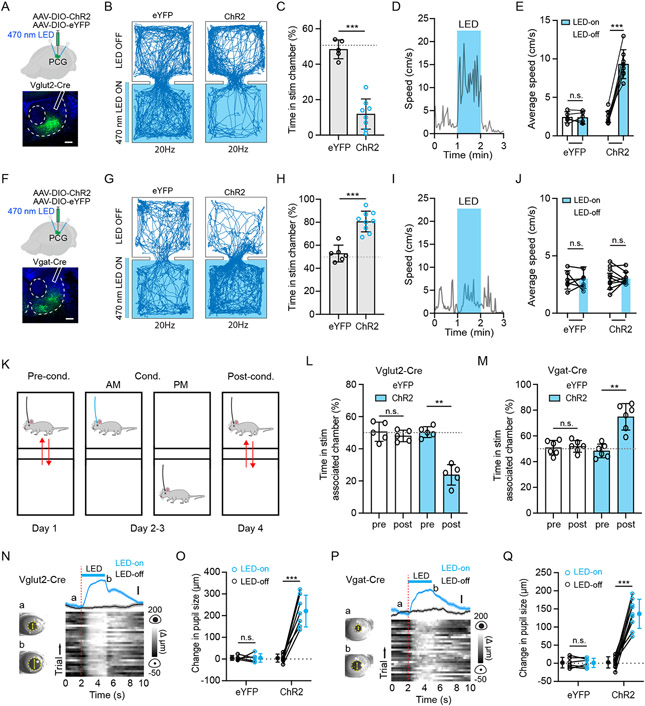
Figure 2. PCG glutamate and GABA neurons drive avoidance and preference behavior, respectively.
(A) Top, experimental condition; Bottom, representative confocal image showing the restricted expression of ChR2 within PCG. Scale, 200 μm.
(B) Example movement tracing for an animal in eYFP group or ChR2 group during a 20 min session of RTPP test with 20-Hz optical stimulation of PCG glutamatergic neurons.
(C) Percentage time spent in the LED-On chamber for the eYFP (n = 5) and ChR2 (n = 8) groups. Gray dash line marks 50% level. ***P < 0.001, t-test.
(D) Plot of locomotion speed in an open field test for an example animal. Blue box marks the duration of LED stimulation of PCG Vglut2+ neurons.
(E) Average speed in LED-On (1 min) and LED-Off epochs. N = 5 and 8 for the eYFP and ChR2 group, respectively. ***P < 0.001, paired t-test.
(F) Similar to (A) but for a Vgat-Cre mouse. Scale, 200 μm.
(G) Example movement tracing for a Vgat-Cre animal during a 20 min session of RTPP test with 20-Hz optical stimulation of PCG GABAergic neurons.
(H) Percentage time spent in the LED-On chamber for the eYFP (n = 6) and ChR2 (n = 9) groups. ***P < 0.001, t-test.
(I) Plot of locomotion speed in an open field test for an example Vgat-ChR2 animal.
(J) Average speed in LED-On (1 min) and LED-Off epochs. N = 6 and 9 respectively. P > 0.05, paired t-test.
(K) Timeline for CPA/CPP test.
(L and M) Percentage time spent in the LED-On chamber pre- and post-conditioning by activating PCG Vglut2+ neurons (L, n = 5 for each group) and Vgat+ neurons (M, n = 6 for each group). **P < 0.01, paired t-test.
(N) Plot of change in pupil size in responding to LED stimulation for an example Vglut2-Cre animal. Left, example images of pupil during baseline (a) and dilated (b) conditions. Right, plot of average change in pupil size (mean ± SEM) aligned to onset of optical stimulation (top) and Δ pupil size in each of 30 trials (bottom) for an example animal. Scale, 50 μm.
(O) Average change in pupil size in LED-On and LED-Off conditions. N = 5 and 7 respectively. ***P < 0.001, paired t-test.
(P) Plot of change in pupil size in responding to LED stimulation for an example Vgat-Cre animal. Scale, 50 μm.
(Q) Average change in pupil size in LED-On and LED-Off conditions. N = 6 and 9 respectively. ***P < 0.001, paired t-test.
Error Bar = SD in all plots.

