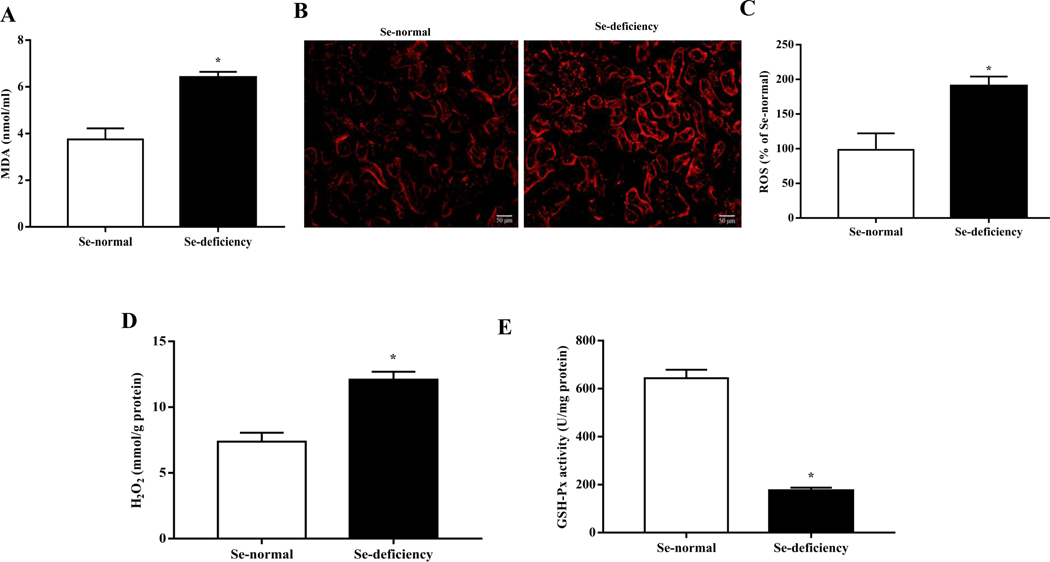
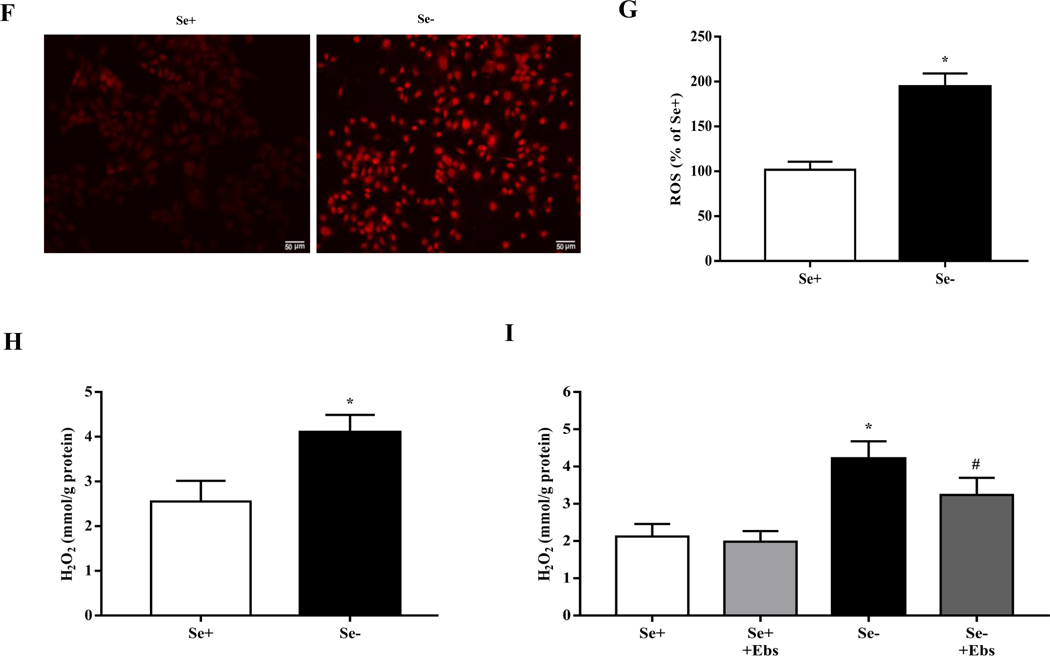
Fig. 4. Increased oxidative stress in selenium-deficient rats.
(A) Serum MDA levels in SD rats fed the selenium-deficient diet for 16 weeks (*P < 0.05 vs Se-normal, n=5/group). (B, C) Fluorescence microscopy images (B) and quantification (C) of renal ROS production in SD rats fed the selenium-deficient diet for 16 weeks (*P < 0.05 vs Se-normal, n=5/group). (D) The levels of renal hydrogen peroxide in the kidney of SD rats fed the selenium-deficient diet for 16 weeks (*P < 0.05 vs Se-normal, n=5/group). (E) The activity of renal GSH-Px in SD rats fed the selenium-deficient diet for 16 weeks (*P < 0.05 vs Se-normal, n=5/group). (F, G) Fluorescence microscopy images (F) and quantification (G) of ROS production in WKY RPT cells incubated with selenium-free media for 48 hours (*P < 0.05 vs Se+, n=5 /group). (H) The levels of hydrogen peroxide in RPT cells incubated with selenium-free media for 48 hours (*P < 0.05 vs Se+, n=5/group). (I) The levels of hydrogen peroxide in RPT cells incubated with selenium-free media and a GPX1 mimic ebselen (Ebs) treatment (30 μm) for 48 hours (*P < 0.05 vs Se+, n=5/group).


