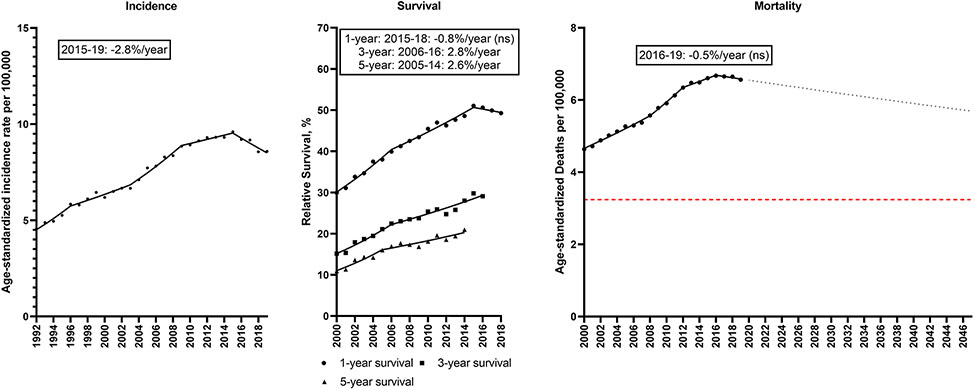
Figure 7. Liver cancer.
Incidence rates (1992-2019), 1, 3 and 5-year relative survival (2000-2018, 2016, 2014) and mortality rates (2000-2019) for liver and intrahepatic bile duct cancer in the U.S. Points represent observed values and lines represent fitted estimates from Joinpoint models. For mortality rates, dashed lines represent projected mortality rates through 2047 based on extrapolating the data from the most recent trend. The red dashed line represents a 50% decline in age-standardized death rates from 2022. Estimates provided are annual percentage changes in rates for the most recent time period. ns: not statistically significant

