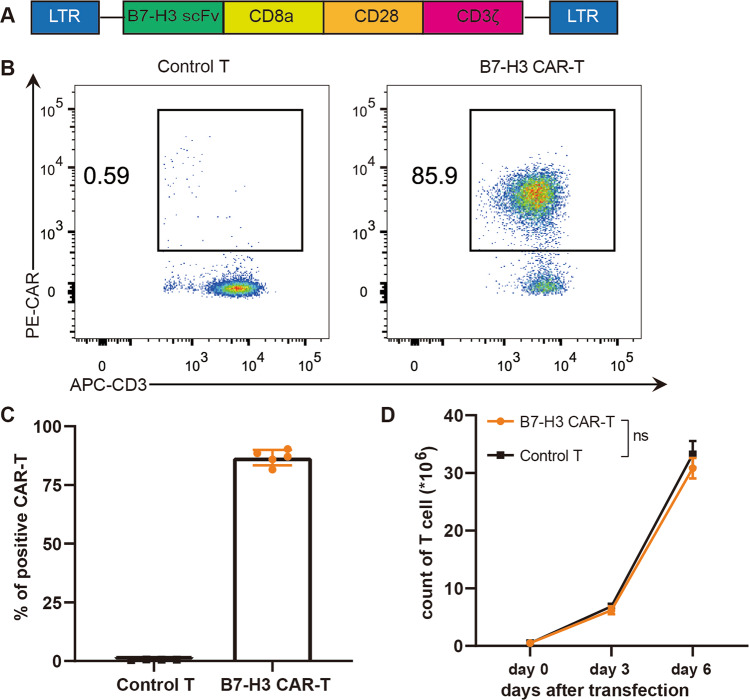
Fig. 2. Construction of B7-H3 CAR-T cells.
A Structural schema of CAR (LTR: long terminal repeat, scFv: single-chain fragment variable). B The expression of IgG-Fc on the surface of T cells was detected by flow cytometry to show the transfection efficiency of CAR. C Statistical graph of the CAR positive rate of T cells. The data are represented as means ± SEM. D Proliferation curves of control T and B7-H3 CAR-T cells. Paired data were analyzed using Student’s t test.

