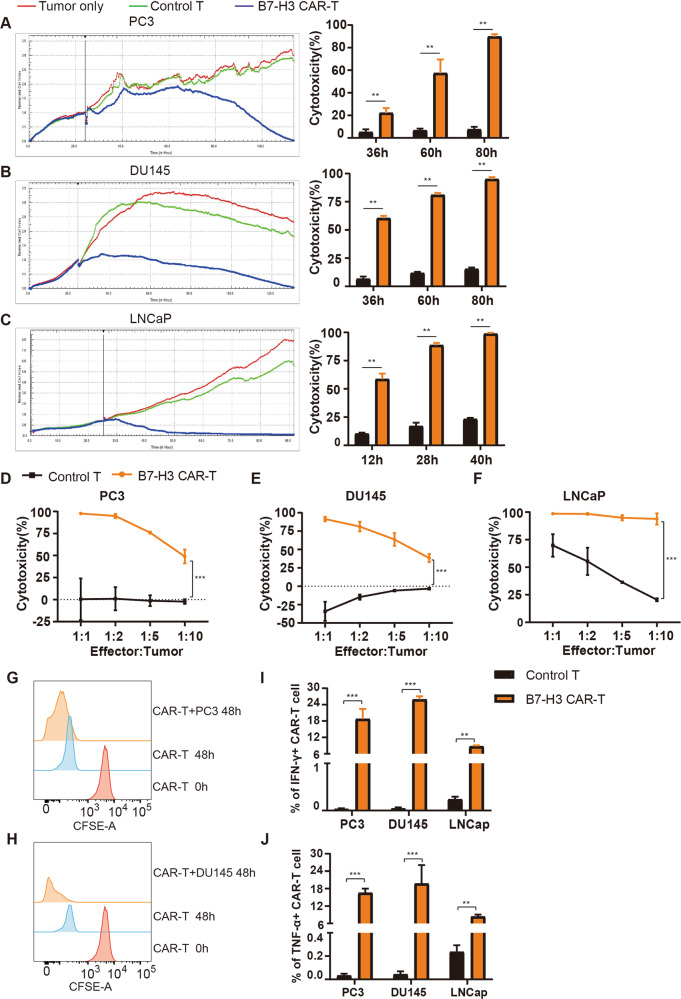
Fig. 3. Cytotoxicity of B7-H3 CAR-T cells against prostate cancer cells.
A–C. Cytotoxicity analysis of B7-H3 CAR-T cells against B7-H3 positive target cells by real-time cell assay. The data are represented as the mean cytotoxicity ± SEM. D–F Flow cytometry detected the final proportion of T cells co-cultured with PC3 (D), DU145 (E) or LNCaP (F), and calculated the percentage of killing. The data are represented as the mean cytotoxicity ± SEM. G, H Effect of tumor cells on the proliferation of B7-H3 CAR-T cells by FCM; flow cytometry was used to detect the fluorescence intensity of control T and B7-H3 CAR-T cells to reflect the proliferation of T cells after co-incubating CFSE-stained T cells with PC3 (G) or DU145 (H). I, J Effect of tumor cells on the cytokine release of B7-H3 CAR-T cells by FCM; T cells were subjected to membrane permeation, fixation, and antibody staining to detect the IFN-γ (I) and TNF-α (J) levels of control T and B7-H3 CAR-T cells under the stimulation of prostate cancer cells. These data are expressed as the mean percentage of cytokines ± SEM. **P < 0.05, ***P < 0.001.

