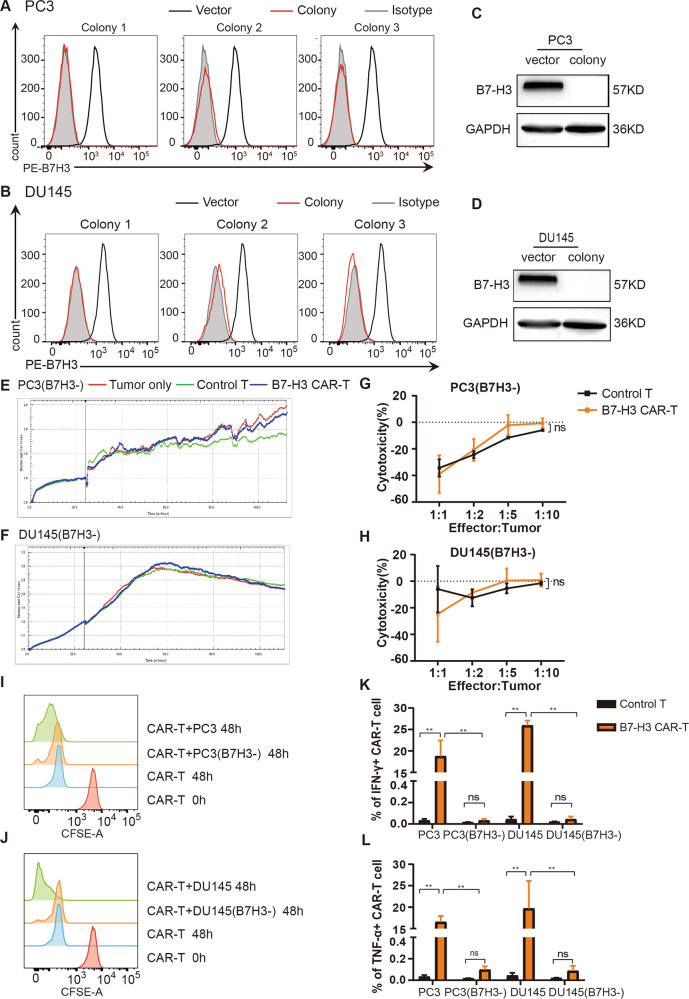
Fig. 4. Cytotoxicity of B7-H3 CAR-T cells against B7-H3 negative tumor cells.
A, B. The expression of B7-H3 protein on the surface of PC3(B7H3-) (A) and DU145(B7H3-) (B) monoclonal cells was detected by flow cytometry. C, D Western blot was utilized to confirm the expression of B7-H3 in PC3, PC3(B7H3-), DU145, and DU145(B7H3-) cells. E, F RTCA was used to verify the killing of control T and B7-H3 CAR-T cells to B7-H3 negative PC3(B7H3-) (E) and DU145(B7H3-) (F), and the right figure is the corresponding statistics. G, H The killing of PC3(B7H3-) (G) or DU145(B7H3-) (H) with B7-H3 CAR-T and control T cells was assessed via FCM. The killing effect of T cells on tumor cells was calculated by the mean ± SEM. I, J CFSE staining was used to detect the proliferation of control T and CAR-T cells co-incubated with PC3(B7H3-) (I) or DU145(B7H3-) (J). K, L The release of IFN-γ (K) and TNF-α (L) from T cells under the stimulation of B7-H3 negative tumor cells. These data are exhibited as the mean percentage of cytokines ± SEM. **P < 0.05.

