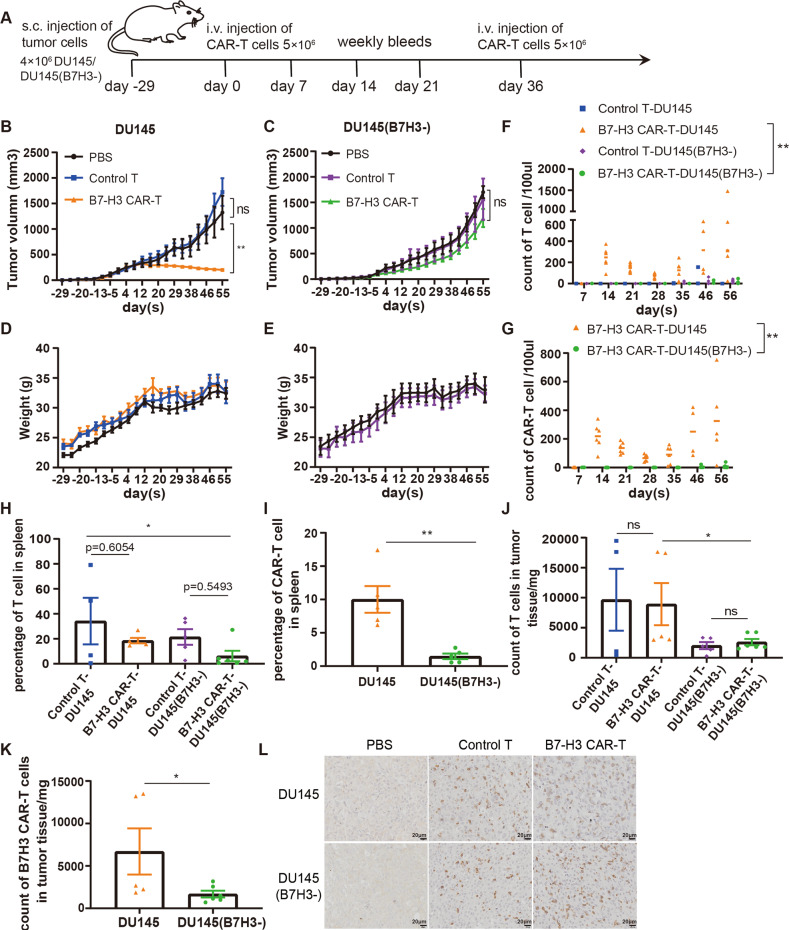
Fig. 5. Antitumor effect of B7-H3 CAR-T cells in xenograft mice.
A Treatment protocol for subcutaneous xenograft tumors, DU145, and DU145 (B7H3-) in NCG mice. B, C Tumor volume curves of DU145 and DU145(B7H3-) mice treated with PBS (n = 4), control T cells (n = 5), and B7-H3 CAR-T cells (n = 6). The tumor volume data are represented as mean ± SEM (mm3). D, E Body weight curves of the two mouse models. The tumor weight data are represented as mean ± SEM (g). F, G Content of T cells (Figure F) and CAR-T cells (G) in the peripheral blood of mice. H, I Percentage of T cells (H) and CAR-T cells (I) in the spleen. J, K Numbers of T cells (J) and CAR-T cells (K) in tumor tissues. L Immunohistochemical analysis of T cell infiltration in tumor tissue (Scale bar, 20 × 50 μm). All of the results are expressed as the mean of triplicate values ± SEM. **P < 0.01, *P < 0.05 via ANOVA for multiple comparisons of the three treatment groups.

