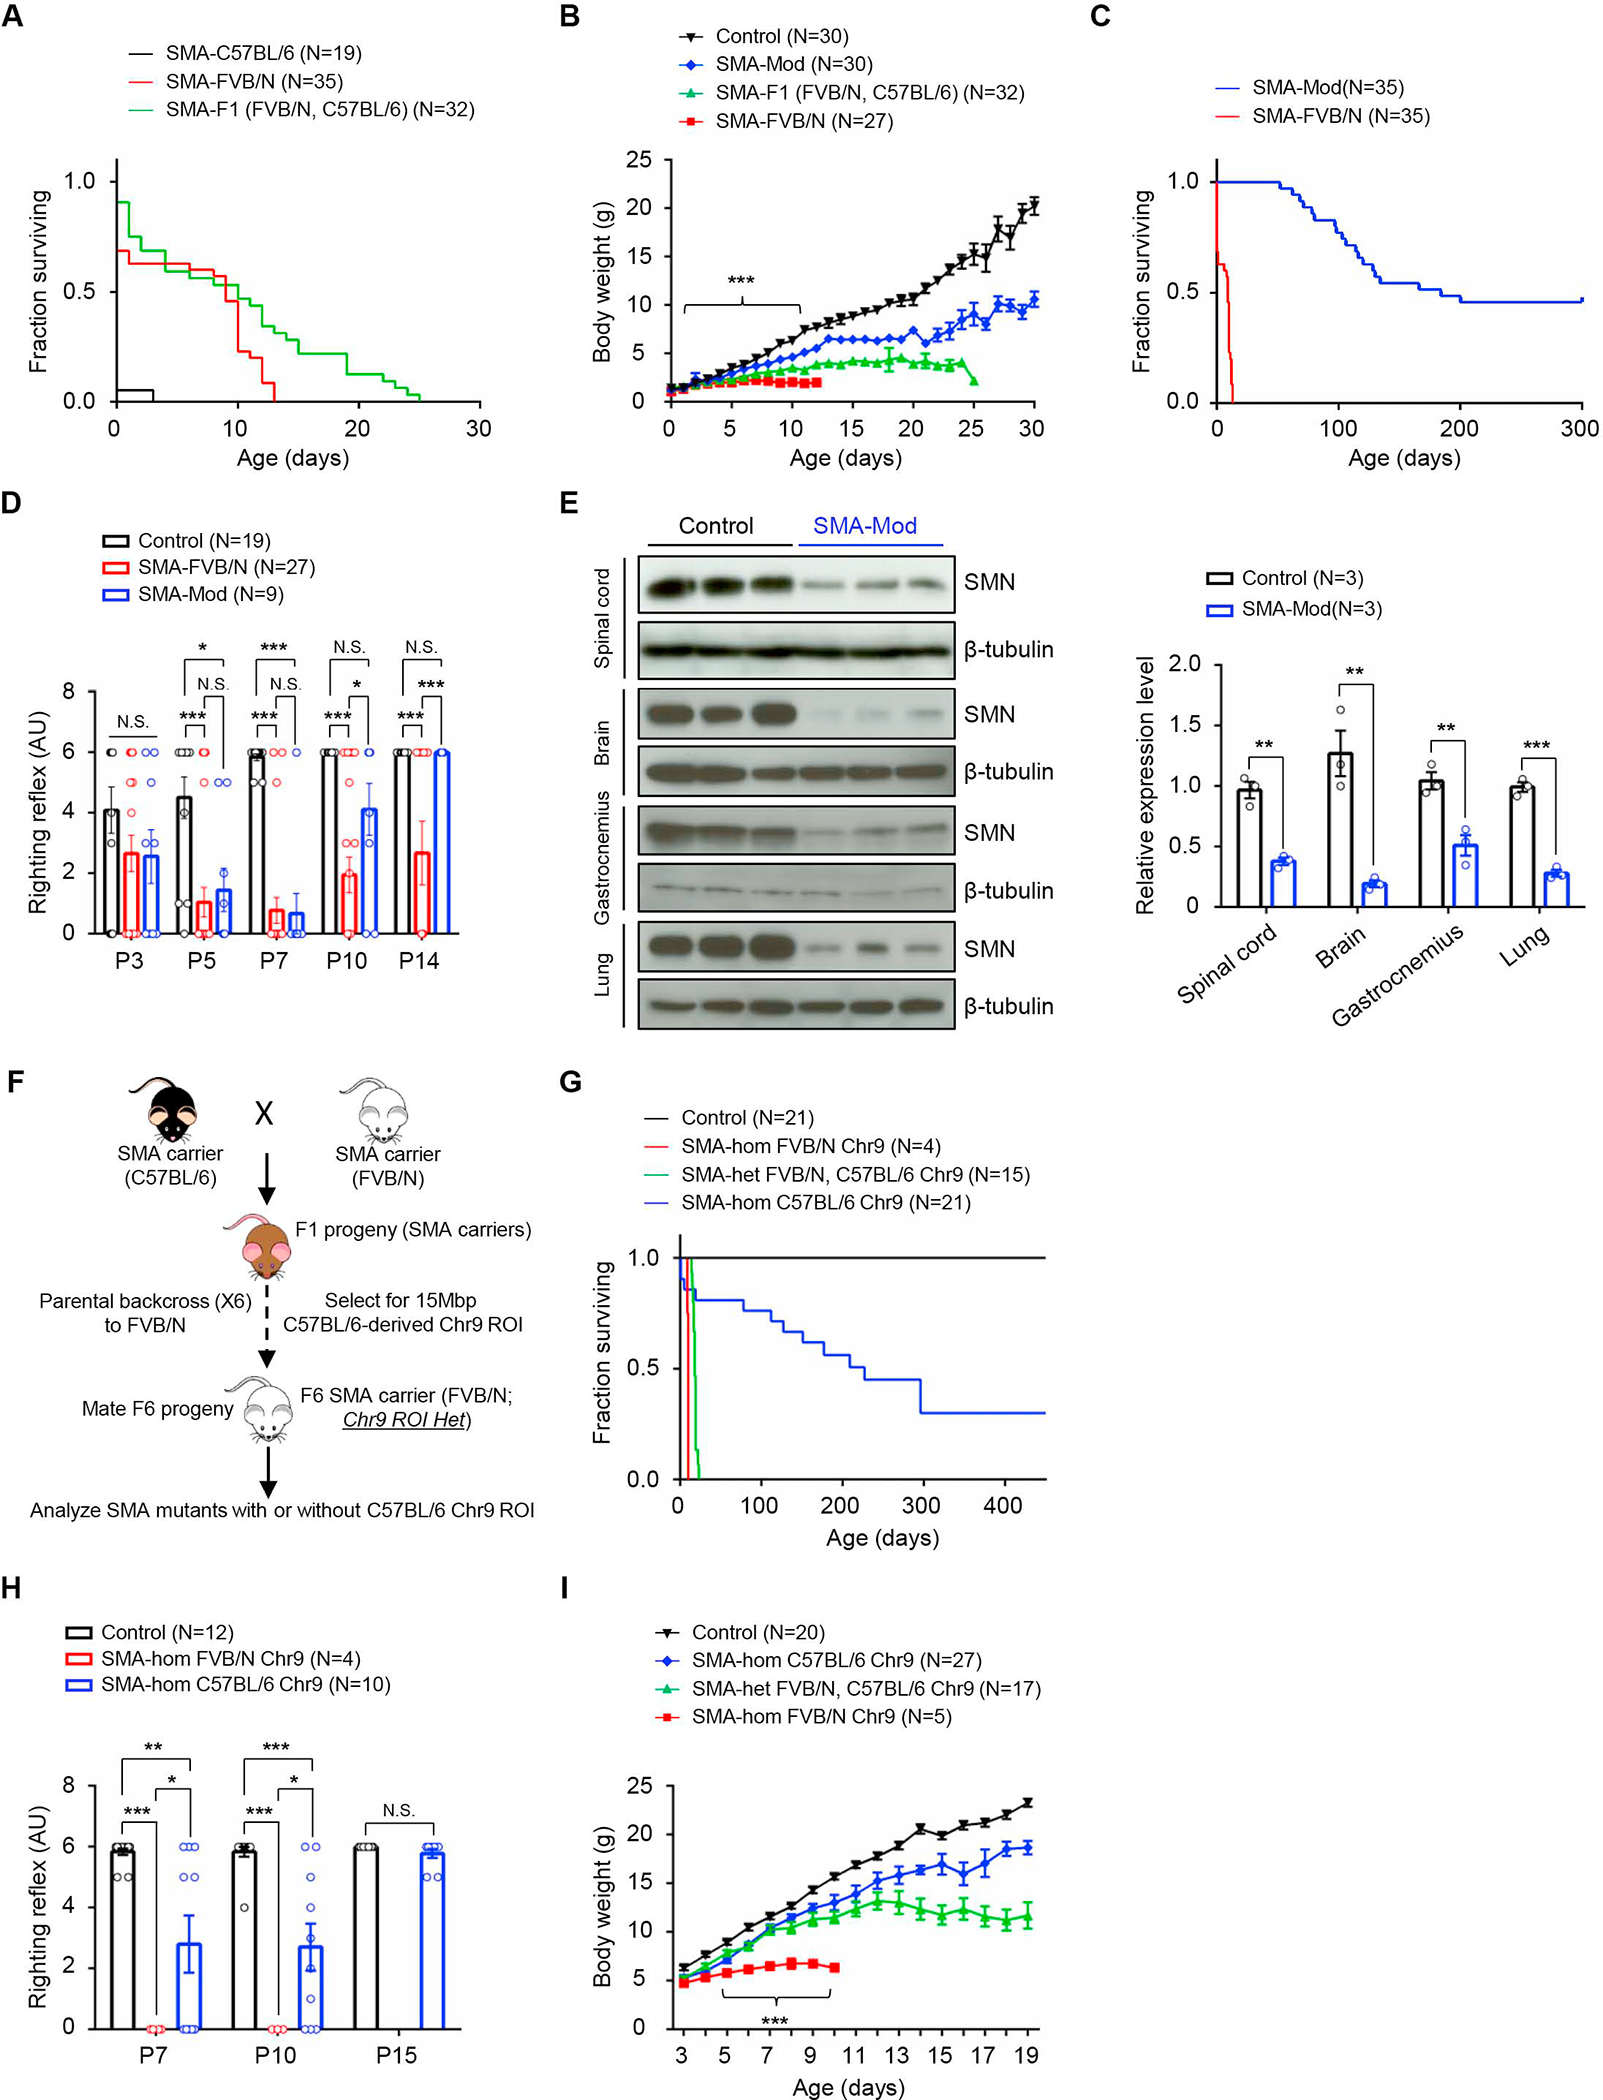
Figure 1. Evidence and mapping of a C57BL/6-derived modifier of SMA in model mice.

(A) Kaplan-Meier survival curves depicting altered lifespans of model mice on pure or hybrid strain backgrounds. P < 0.0001 between C57BL/6 and FVB/N mutants, log-rank test. (B) Weight curves of pure and hybrid strain SMA mutants. ***, P < 0.001, PND2 – PND12 between FVB/N and SMA-Mod mutants, t tests. Reduced disease severity in SMA-Mod mutants relative to FVB/N-derived mutants, as assessed by (C) increased lifespans and (D) improved motor performance. Note: P < 0.0001 for panel (C) log-rank test; *, **, ***, P < 0.05, P < 0.01 and P < 0.001 respectively, Kruskal-Wallis test (D). (E) Western blots and quantified results of blots depicting greatly reduced SMN in SMA-Mod mutants. **, ***, P < 0.01 and P < 0.001 respectively, t tests. (F) Diagrammatic representation of the strategy employed to map the SMA modifier to Chr.9. (G) Kaplan-Meier survival curves demonstrating that mutants harboring the C57BL/6-derived Chr.9 ROI are more mildly affected than those homozygous FVB/N for this genomic region. P < 0.0001 between SMA-hom C57BL/6 and SMA-hom FVB/N mutants, log-rank test. SMA-hom C57BL/6 Chr.9 mutants were also less severely affected based on (H) the righting reflex assay and (I) their tendency to gain more weight than their SMA-hom FVB/N Chr.9 counterparts. Note: *, **, P < 0.05 and P < 0.01, Kruskal-Wallis test for panel (H); ***, P < 0.001 between SMA-hom C57BL/6 and SMA-hom FVB/N mutants in panel (I). N.S. – not significant. SMA-Mod – SMN2+/+;SMNΔ7+/+;Hspa8G470R;Smn−/−, Controls – SMN2+/+;SMNΔ7+/+;Smn+/−. Data: mean ± SEM. See also Video S1, Table S1 and Figs. S1–S3.
