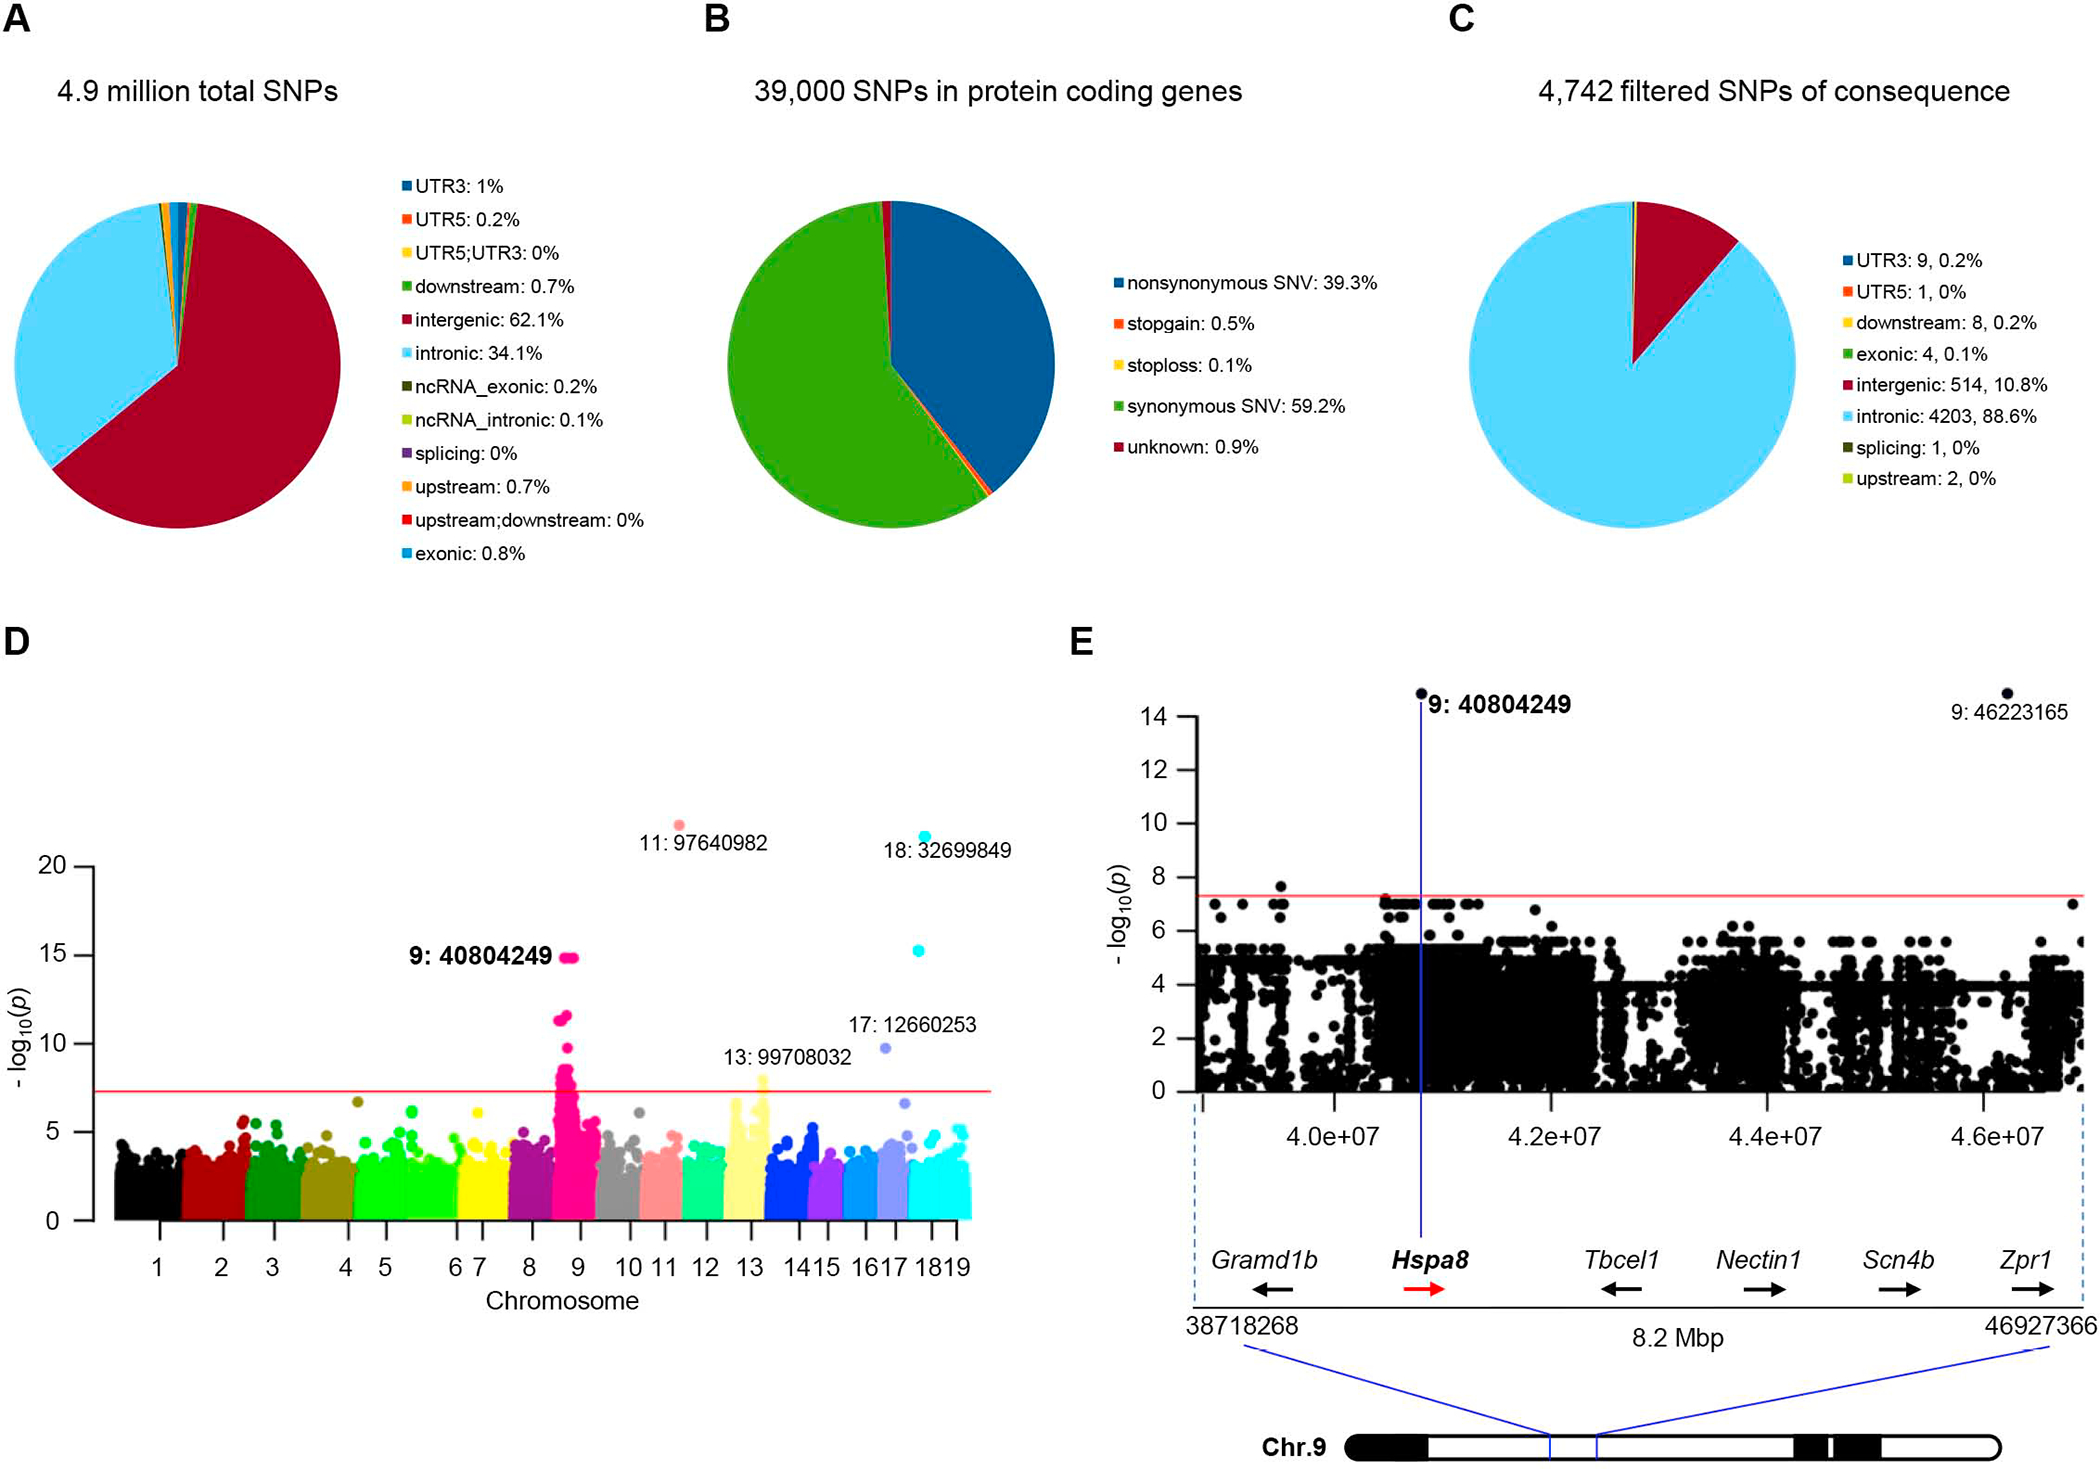
Figure 2. GWAS links an Hspa8 variant to SMA disease suppression.

Graphical representations of (A) the total number of variant SNPs in the modified SMA mice, and (B) those in protein-coding genes. (C) Pie chart of SNPs filtered for P values < 5×10⁻⁸ and predicted for mutational consequences by ANNOVAR. (D) Manhattan plot of highly significant variant SNPs linked to the modified SMA phenotype, emphasizing those clustered in the Chr. 9 ROI; magenta line signifies P = 5×10⁻⁸. (E) Restricted view of the Manhattan Plot depicting the Chr. 9 Hspa8 c.G1408C SNP (id: 9:40804249, exon 7) underlying the Hspa8G470R variant (P = 1.5×10⁻¹⁵). See also Tables S2, S3.
