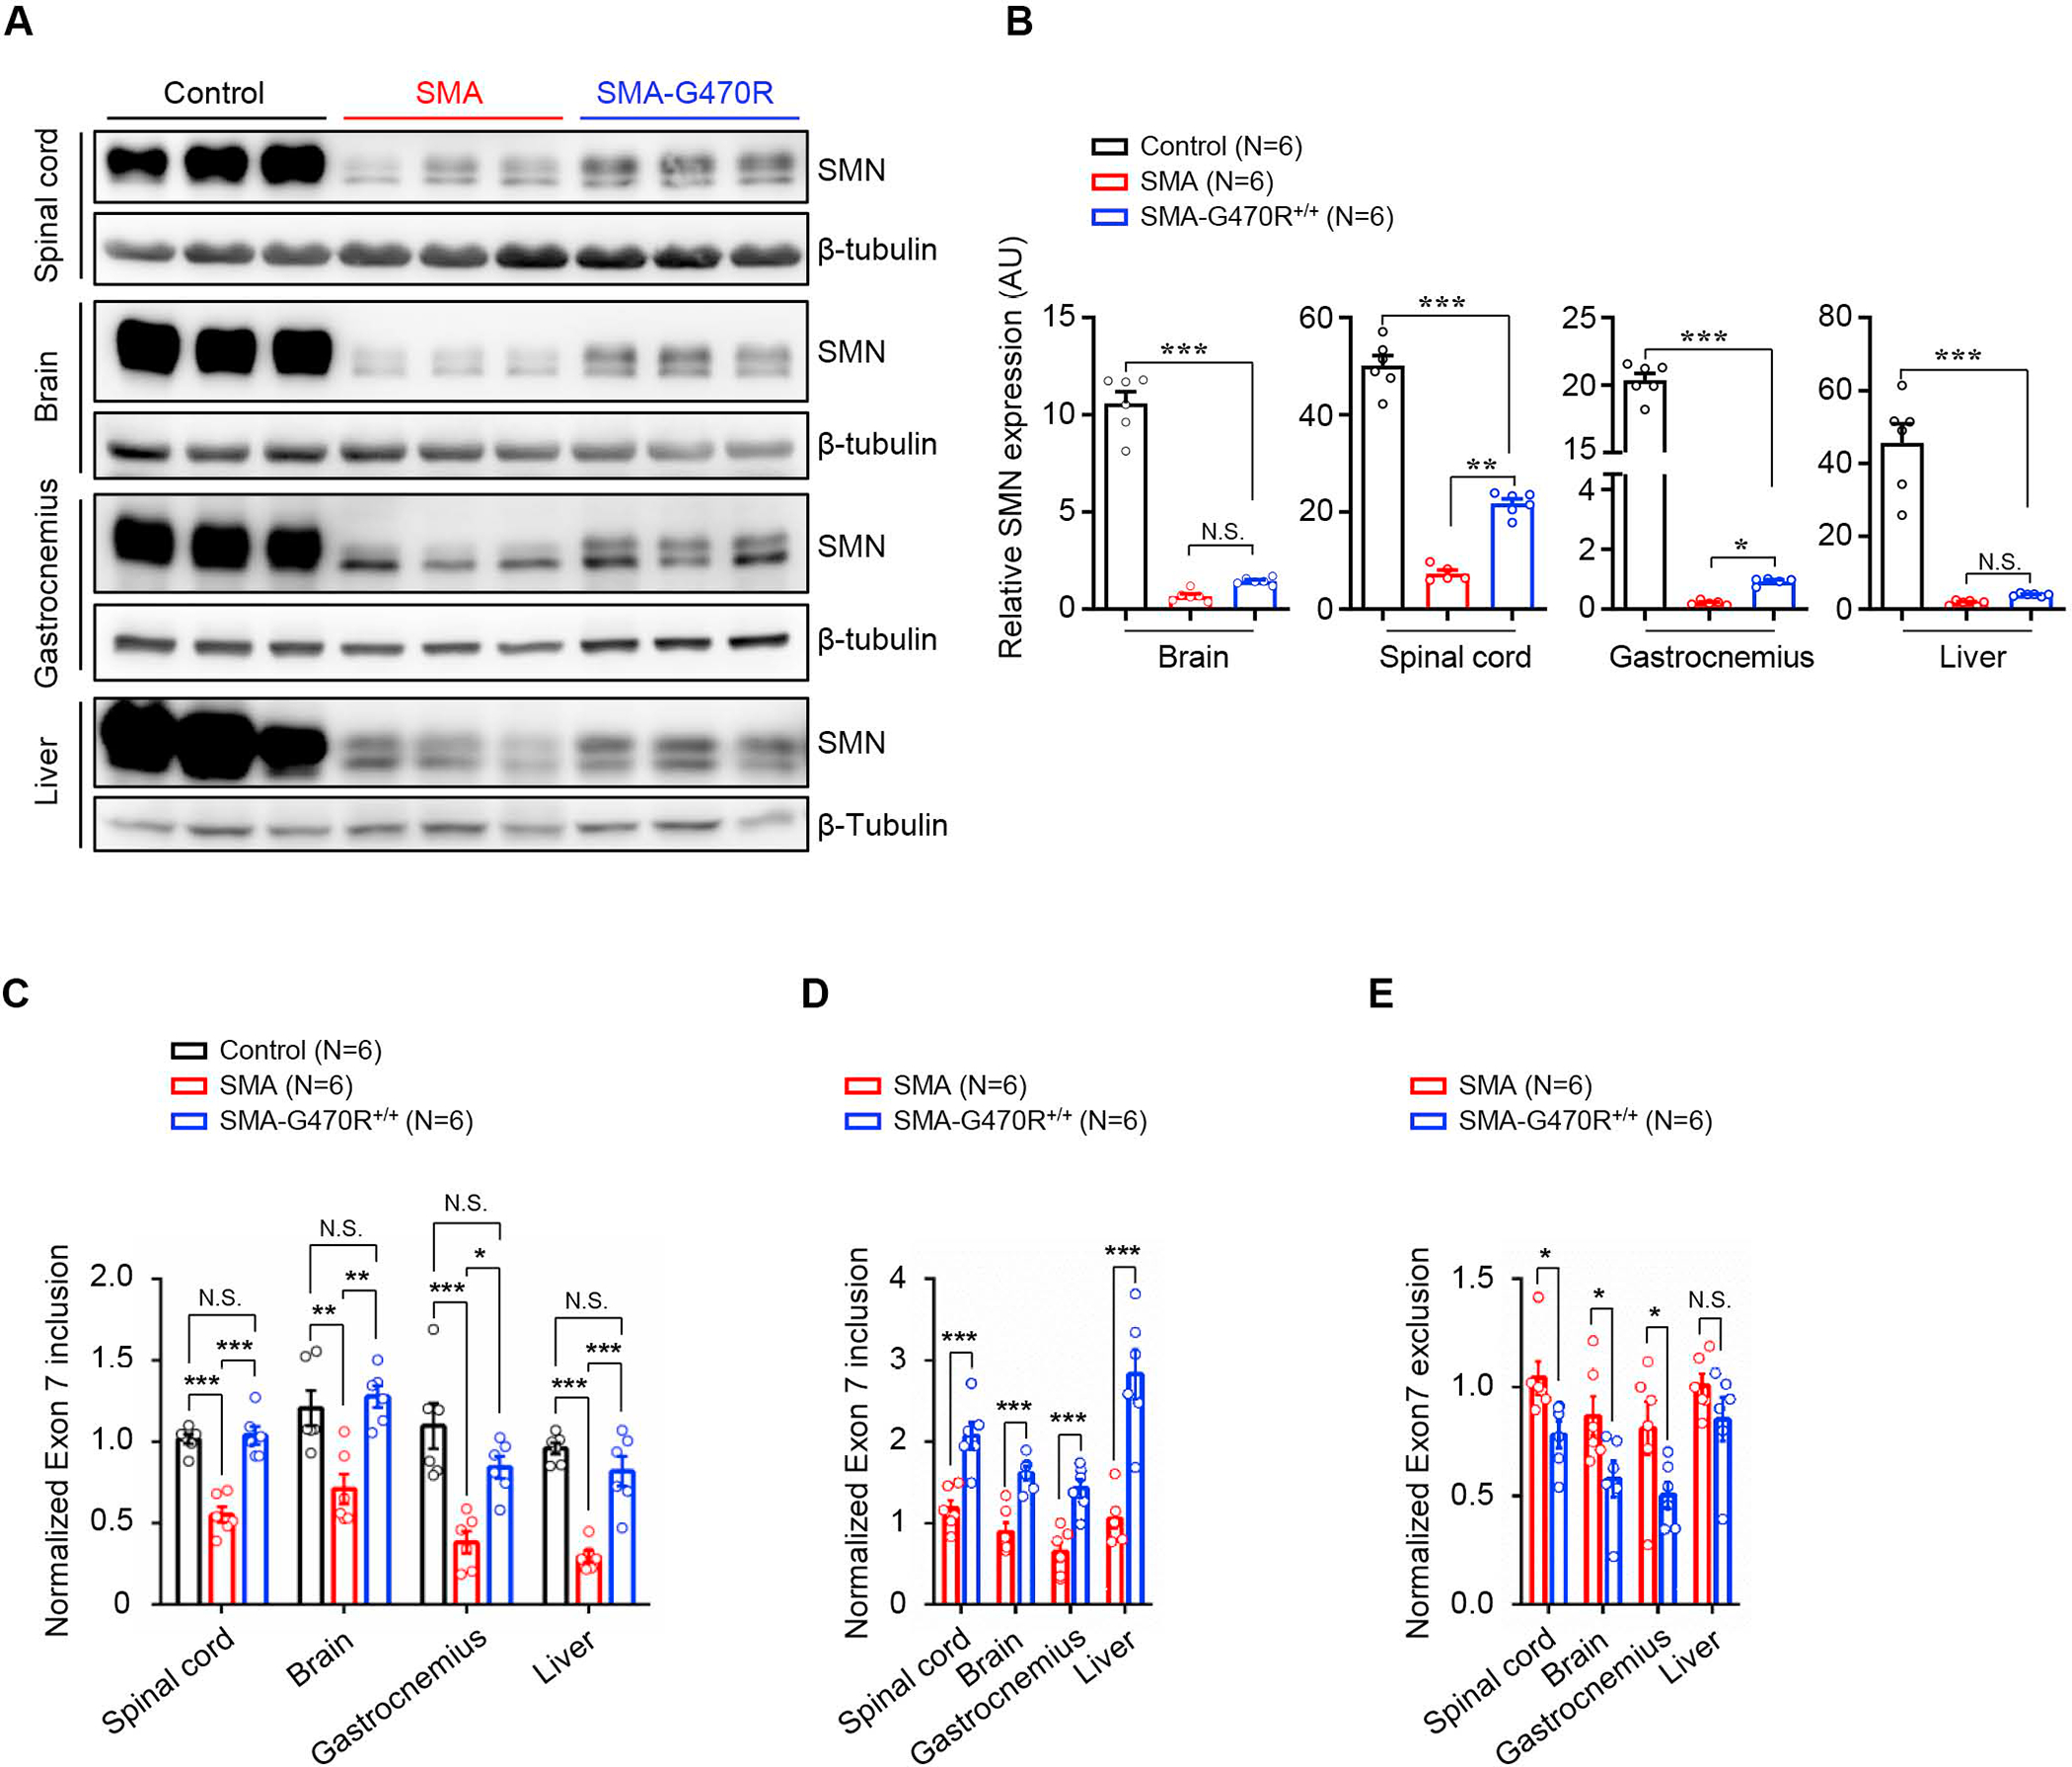
Figure 5. Hspa8G470R alters SMN2 splicing and modestly raises SMN levels.

(A) Western blots of SMN protein in PND9 controls and SMA mutants with or without the G470R modifier and (B) quantified results of the blots in the three cohorts of mice. (C) Analysis of FL-SMN transcript levels by Q-PCR at PND9 in the three cohorts of mice. Two-way comparisons of (D) FL-SMN transcript levels and (E) the SMNΔ7 isoform in the two sets of SMA mutants illustrate an increase in the intact transcript and a corresponding drop in the truncated form. Note: *, **, ***, P < 0.05, P < 0.01, P < 0.001 respectively, one-way ANOVA (panels B and C), t tests, panels (D and E). Data: mean ± SEM. See also Figs. S5, S6.
