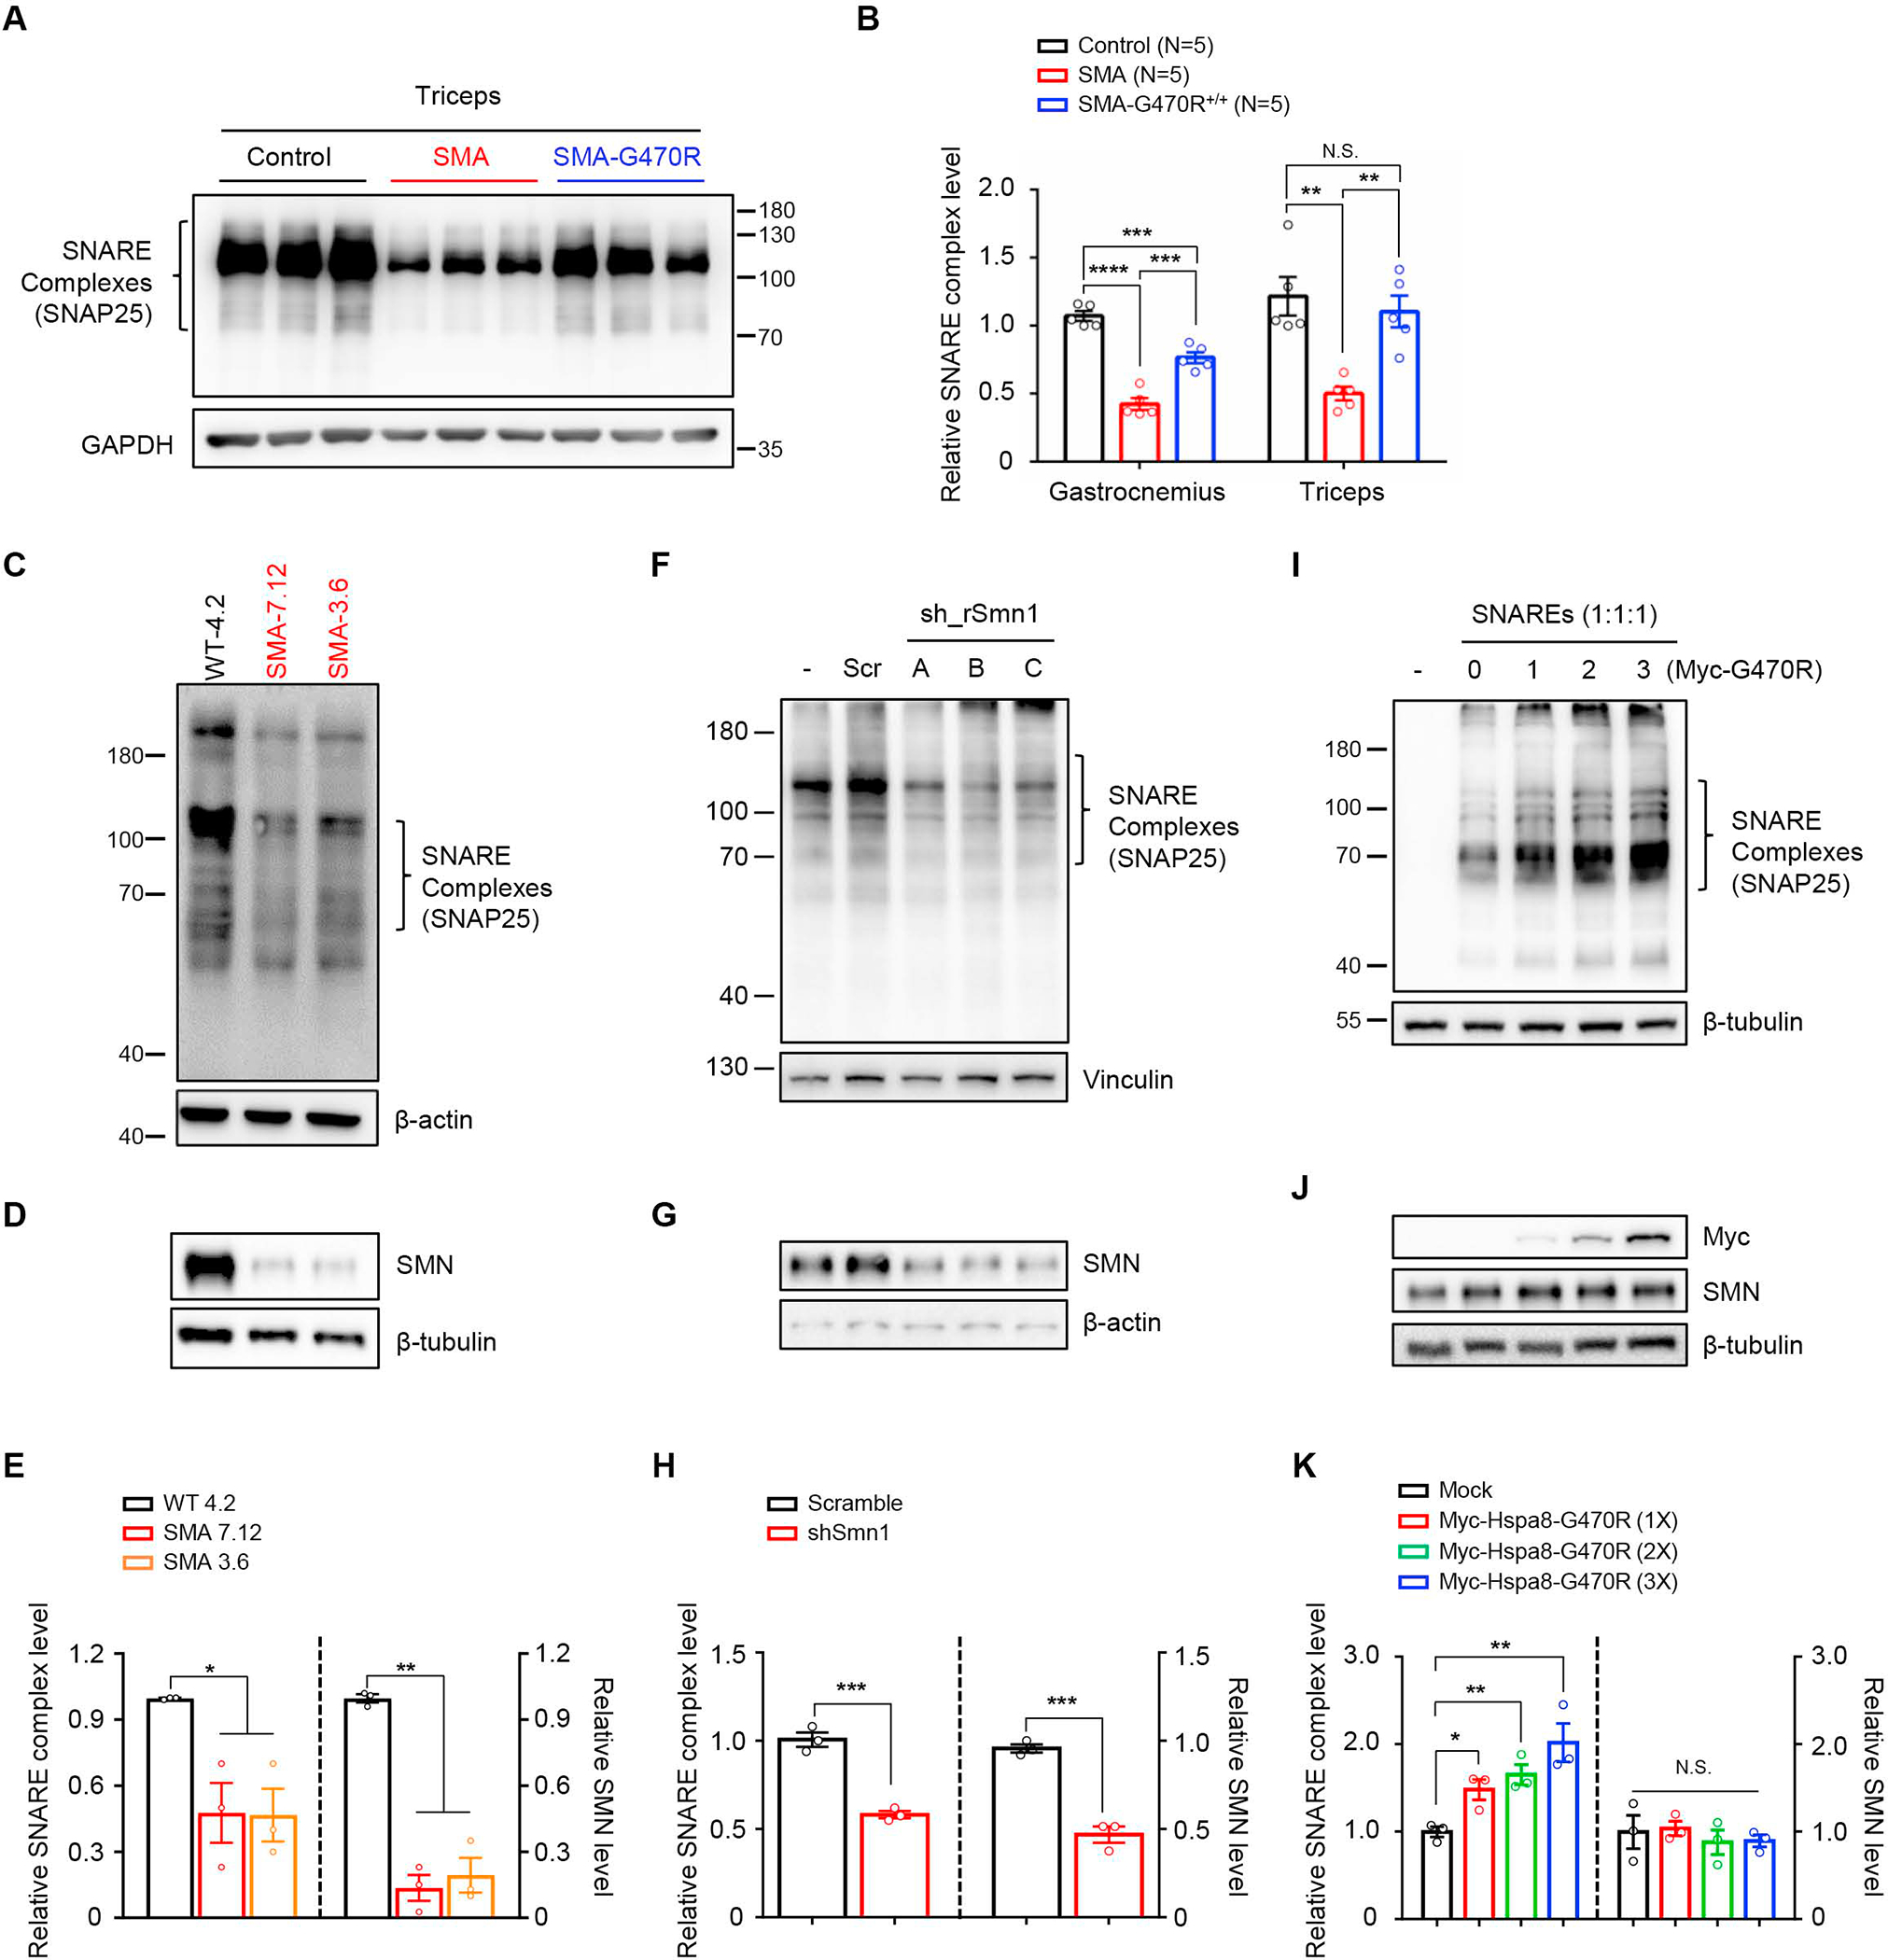
Figure 7. SNARE complex assembly is disrupted in SMA NMJs and restored by the Hspa8G470R variant.

(A) Representative immunoblot, probed for SNAP25, illustrating reduced high molecular weight SDS-resistant SNARE complexes in PND9 SMA NMJs derived from triceps; complex levels are restored in SMA-G470R mutants. Note: Samples were not boiled. (B) Quantified SNARE complex levels in triceps and gastrocnemius muscles of PND9 controls and SMA mutants with or without the G470R variant. Note: **, ***, P < 0.01, P < 0.001 respectively, one-way ANOVA. N.S. – not significant. (C) Representative immunoblot depicting reduced SNARE complexes in two iPSC-derived motor neuron lines from severe SMA patients; samples were not boiled. (D) Western blot analysis of boiled samples from panel c confirm low levels of SMN in the SMA lines. (E) Graph showing relative SNARE complex concentrations and SMN levels in panels C and D respectively. (F) Reduced SNARE complex assembly is observed in the immunoblot of samples from PC-12 cells expressing shRNAs against SMN; samples were not boiled. (G) Western blot analysis of boiled samples from panel F confirm low levels of SMN in shRNA-mediated knockdown lines. (H) Quantified SNARE complex and SMN levels in samples analyzed for study depicted in panels F and G. Note: ***, P < 0.001, respectively, t tests for analysis of data in panel (H). (I) Immunoblot depicting effect of raising Hspa8G470R levels (from a plasmid) on SNARE complex formation in HEK293 cells transfected with the core SNARE components; samples were not boiled. (J) Western blot analysis of boiled samples from panel (I) showing relatively stable levels of SMN notwithstanding increasing concentrations of Myc-Hspa8G470R, as detected with anti-myc antibody. (K)Quantified levels of SNARE complexes and SMN respectively in panels I and J. Note: *, **, P < 0.05, P < 0.01, respectively, one-way ANOVA. N.S. – not significant. Data: mean ± SEM. See also Figs. S8, S9.
