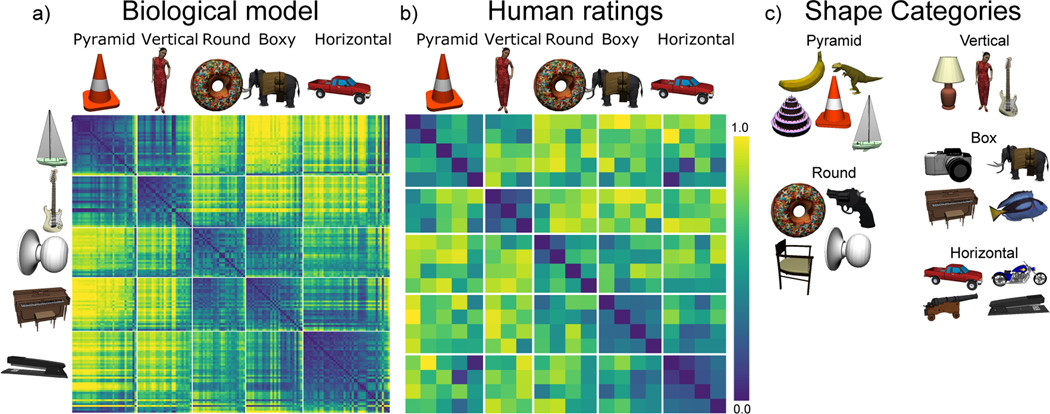
Figure 7:
a) Category similarity structure that emerged in the highest layer, TE, of the biologically based predictive learning model, showing dissimilarity (1-correlation) of the TE representation for each 3D object against every other 3D object (156 total objects). Blue cells have high similarity. Model has learned block-diagonal clusters or categories of high-similarity groupings, contrasted against dissimilar off-diagonal other categories. Clustering maximized average within – between dissimilarity (see Appendix), and clearly corresponded to the shown shape-based categories, with exemplars from each category shown. Also, all items from the same basic-level object categories (N=20) are reliably subsumed within learned categories. b) Human similarity ratings for the same 3D objects, presented with the V1 reconstruction (see Fig 1b) to capture coarse perception in the model, aggregated by 20 basic-level categories (156 × 156 matrix was too large to sample densely experimentally). Each cell is 1 proportion of time given object pair was rated more similar than another pair (see Appendix). The human matrix shares the same centroid categorical structure as the model (confirmed by permutation testing and agglomorative cluster analysis, see Appendix), indicating that human raters used the same shape-based category structure. c) One object from each of the 20 basic level categories, organized into the shape-based categories. The Vertical, Box and Horizontal categories are fairly self-evident and the model was most consistent in distinguishing those, along with subsets of the Pyramid (layer-cake, traffic-cone, sailbot) and Round (donut, doorknob) categories, while banana, trex, chair, and handgun were more variable.

