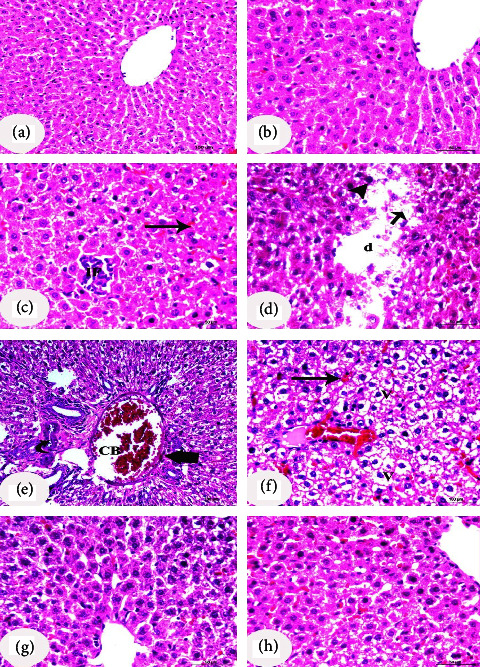
Figure 3.

Photomicrographs of liver sections of rats of the 4 study groups. (a, b) Photomicrographs of the negative control group showed hepatocytes arranged in an orderly and normal hepatic architecture with normal hepatocyte morphology and organized hepatic cell cords radiating from the central vein. (b) is a higher magnification of (a). (c-f) Photomicrographs of the diabetic control group showed disordered hepatocyte, dissolution of cytoplasm (d), monocellular leukocytic infiltration (IF), hydropic degeneration and vacuolations (v), karyomegaly of the nucleus or hyperchromatic nucleus (arrowhead), karyolysis of the nucleus (short arrow), and dilated congested portal vein (CB). The proliferation of bile ducts and degenerative changes in the wall of some bile ducts are also observed (curved arrow). Dilated hyperemic sinusoids (long arrow) and thickened wall (thick arrow) are also seen. Diabetic groups treated with CLHE (g) and CFHE (h) showed amelioration of hepatocytes' microscopical structure, sinusoid, and central vein. Scale bars of photomicrographs (a), (e), and (f) = 100 μm and scale bars of photomicrographs (b), (c), (d), (g), and (h) = 50 μm.
