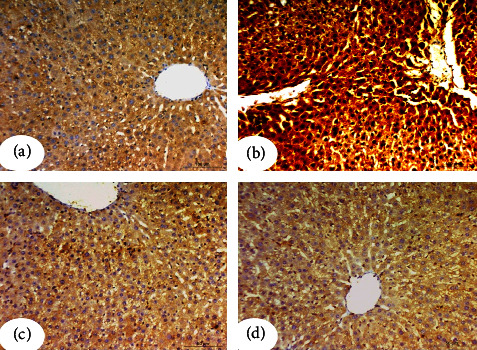
Figure 4.

Photomicrographs from immunohistochemistry assays for liver TNF-α in the 4 study groups. (a) Photomicrograph of the liver of the negative control group. (b) Photomicrograph of the liver of the diabetic control group showed a marked increase in the intensity of TNF-α in the cytoplasm of the hepatocyte. Diabetic rats of pancreas islets treated with CLHE (c) and CFHE, (d) respectively, showed the reduced intensity of TNF-α. Scale bars of figures a and b = 100 μm and scale bars of figures c and d = 50 μm.
