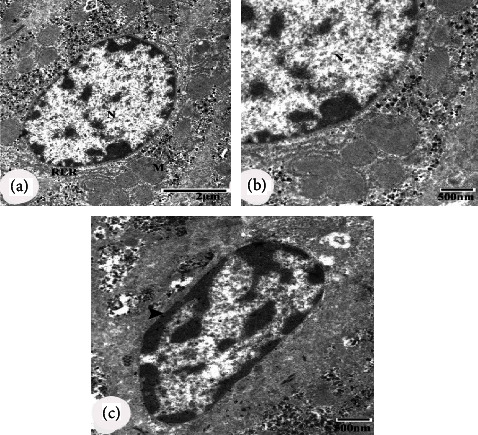
Figure 5.

Electron microscopic (EM) micrographs of hepatocytes of the negative control group. (a, b) EM micrographs showing normal hepatocytes, nucleus (N), mitochondria (m) and rough endoplasmic reticulum (RER) with their preserved structures. (c) EM micrograph showing Kupffer cell (arrowhead). Scale bars of figure a = 2 μm, and scale bars of figures b and c = 500 nm.
