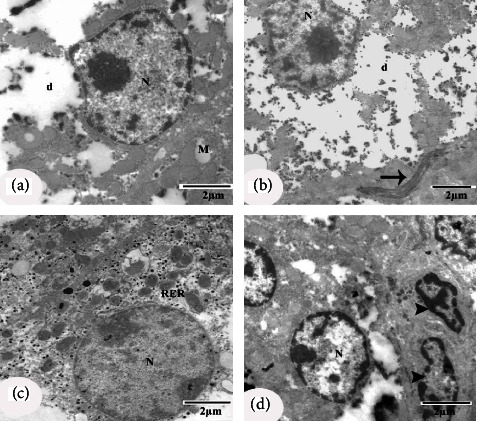
Figure 6.

EM micrographs of hepatocytes of the diabetic control rats. (a–d) EM micrographs showing the dissolution of cytoplasm (d), nucleus (N) with irregular nuclear membrane, collagen fibre bundle (arrow), damaged mitochondria with ill-defined cristae (m), and fragmentation of rough endoplasmic reticulum (RER). (d) EM micrograph showing proliferated Kupffer cell, where nucleus appeared with heterochromatin clumps adjacent to the irregular nuclear membrane (arrowhead). Scale bars of figures a, b, c, and d = 2 μm.
