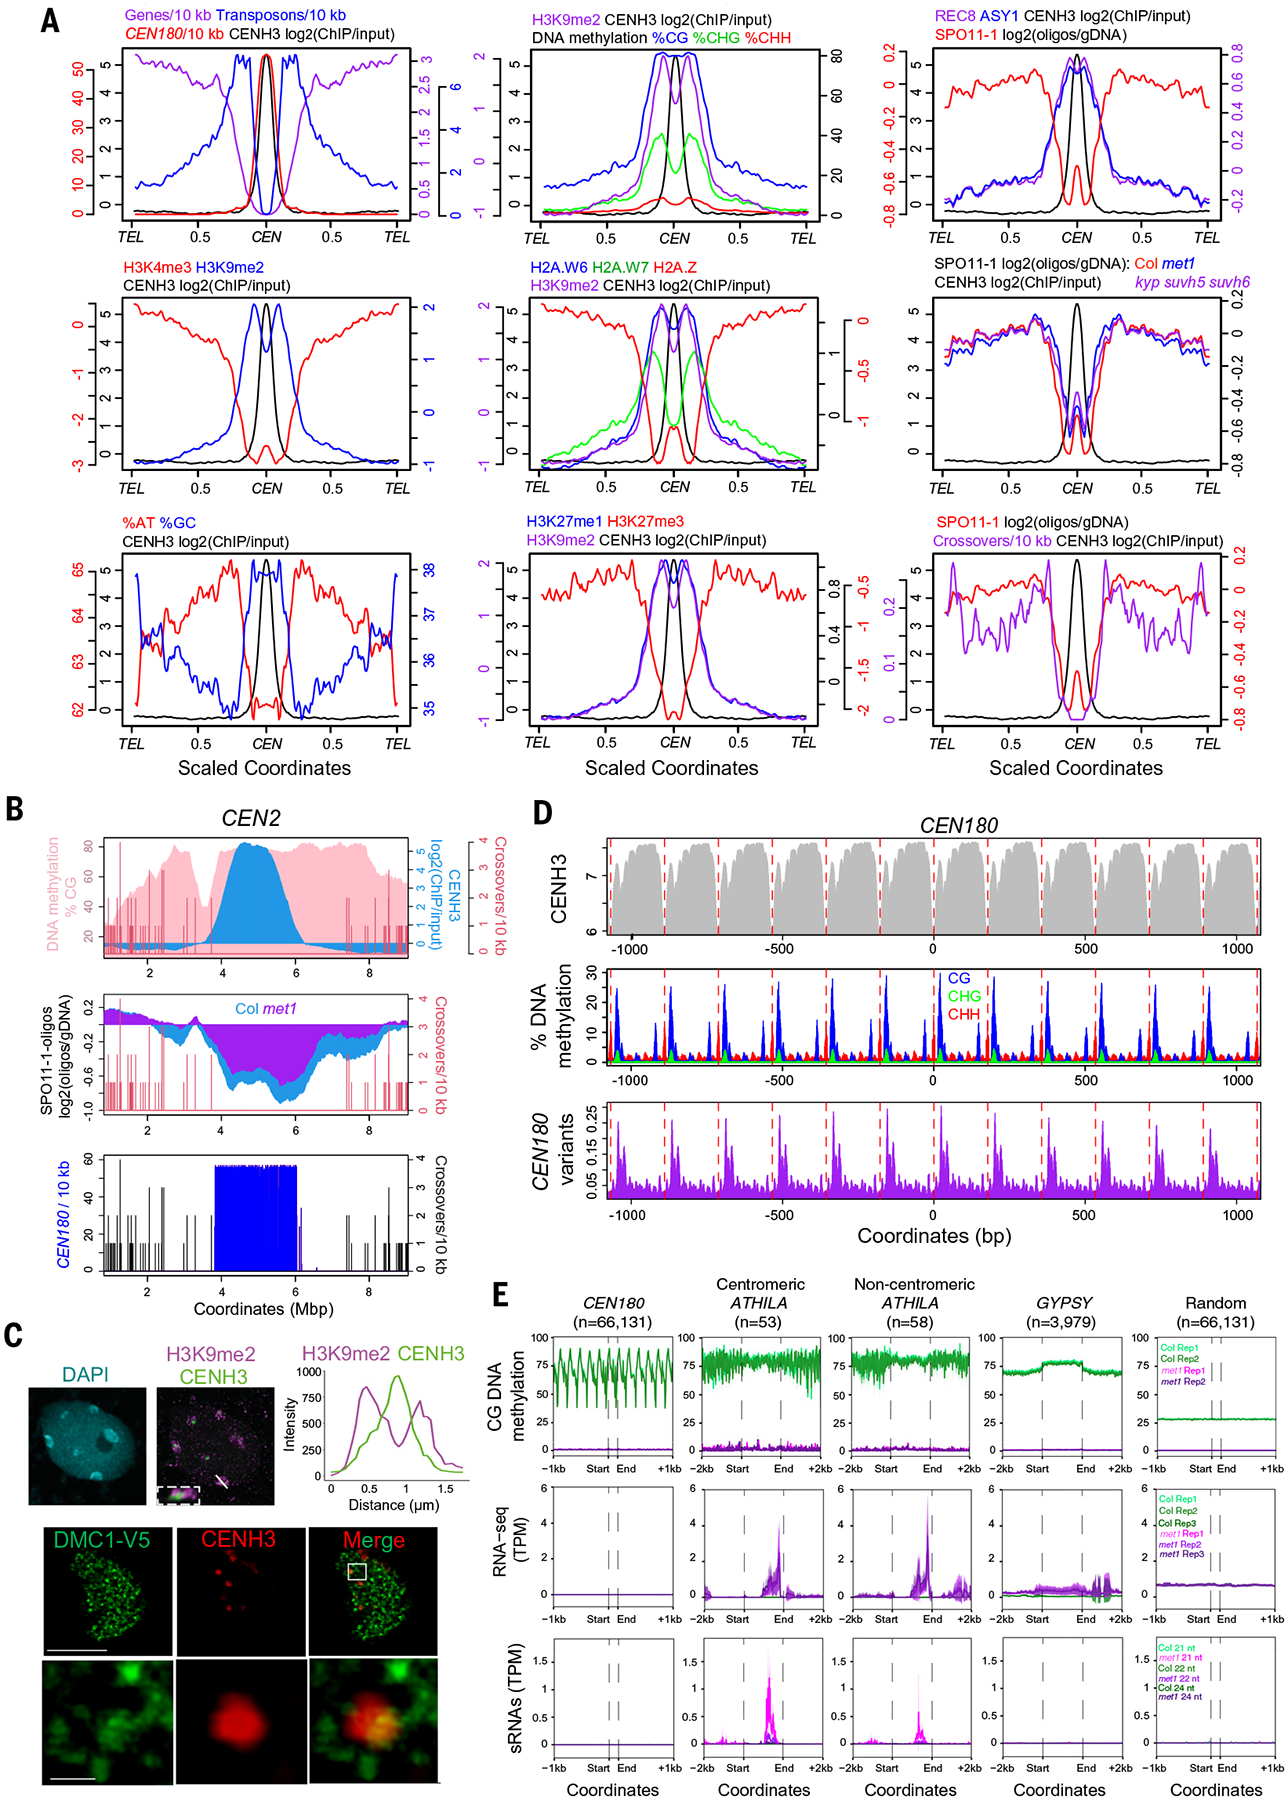
Fig. 4. Epigenetic organization and meiotic recombination within the centromeres.

(A) Quantification of genomic features plotted along chromosome arms that were proportionally scaled between telomeres (TEL) and centromere midpoints (CEN) [defined by maximum CENH3 ChIP-seq log2(ChIP/input) enrichment]. Data analyzed were gene, transposon, and CEN180 density; CENH3, H3K4me3, H3K9me2, H2A.W6, H2A.W7, H2A.Z, H3K27me1, H3K27me3, REC8, and ASY1 log2 (ChIP/input); and percentage of AT/GC base composition, DNA methylation, SPO11-1-oligonucleotides (in wild type and met1), and crossovers (table S7). (B) Plot quantifying crossovers (red), percentage of CG DNA methylation (pink), CENH3 (blue), SPO11-1-oligonucleotides in wild type and met1, and CEN180 density along centromere 2. (C) An interphase nucleus immunostained for H3K9me2 (magenta) and CENH3-GFP (green) is shown at the top. The white line indicates the confocal section used for the intensity plot shown on the right; the region outlined by the white dashed line shows a magnified image of a centromere. The scale bar represents 5 μM. At the bottom is a male meiocyte (early prophase I) immunostained for CENH3 (red) and V5-DMC1 (green). The region outlined by the white line indicates the magnified region shown in the lower row of images. Scale bars are 10 μM (upper) and 1 μM (lower). (D) Plots of CENH3 ChIP enrichment (gray), DNA methylation in CG (blue), CHG (green) and CHH (red) contexts, and CEN180 variants (purple), averaged over windows centered on CEN180 starts. The red dashed lines show 178-bp increments. (E) Metaprofiles of CG-context DNA methylation, RNA-seq, and siRNA-seq in wild type (green) or met1 (pink and purple) (29) around CEN180 (n = 66,131), centromeric intact ATHILA (n = 53), ATHILA located outside the centromeres (n = 58), GYPSY (n = 3979), and random positions (n = 66,131). Shaded ribbons represent 95% confidence intervals for windowed mean values.
