
Figure 3.
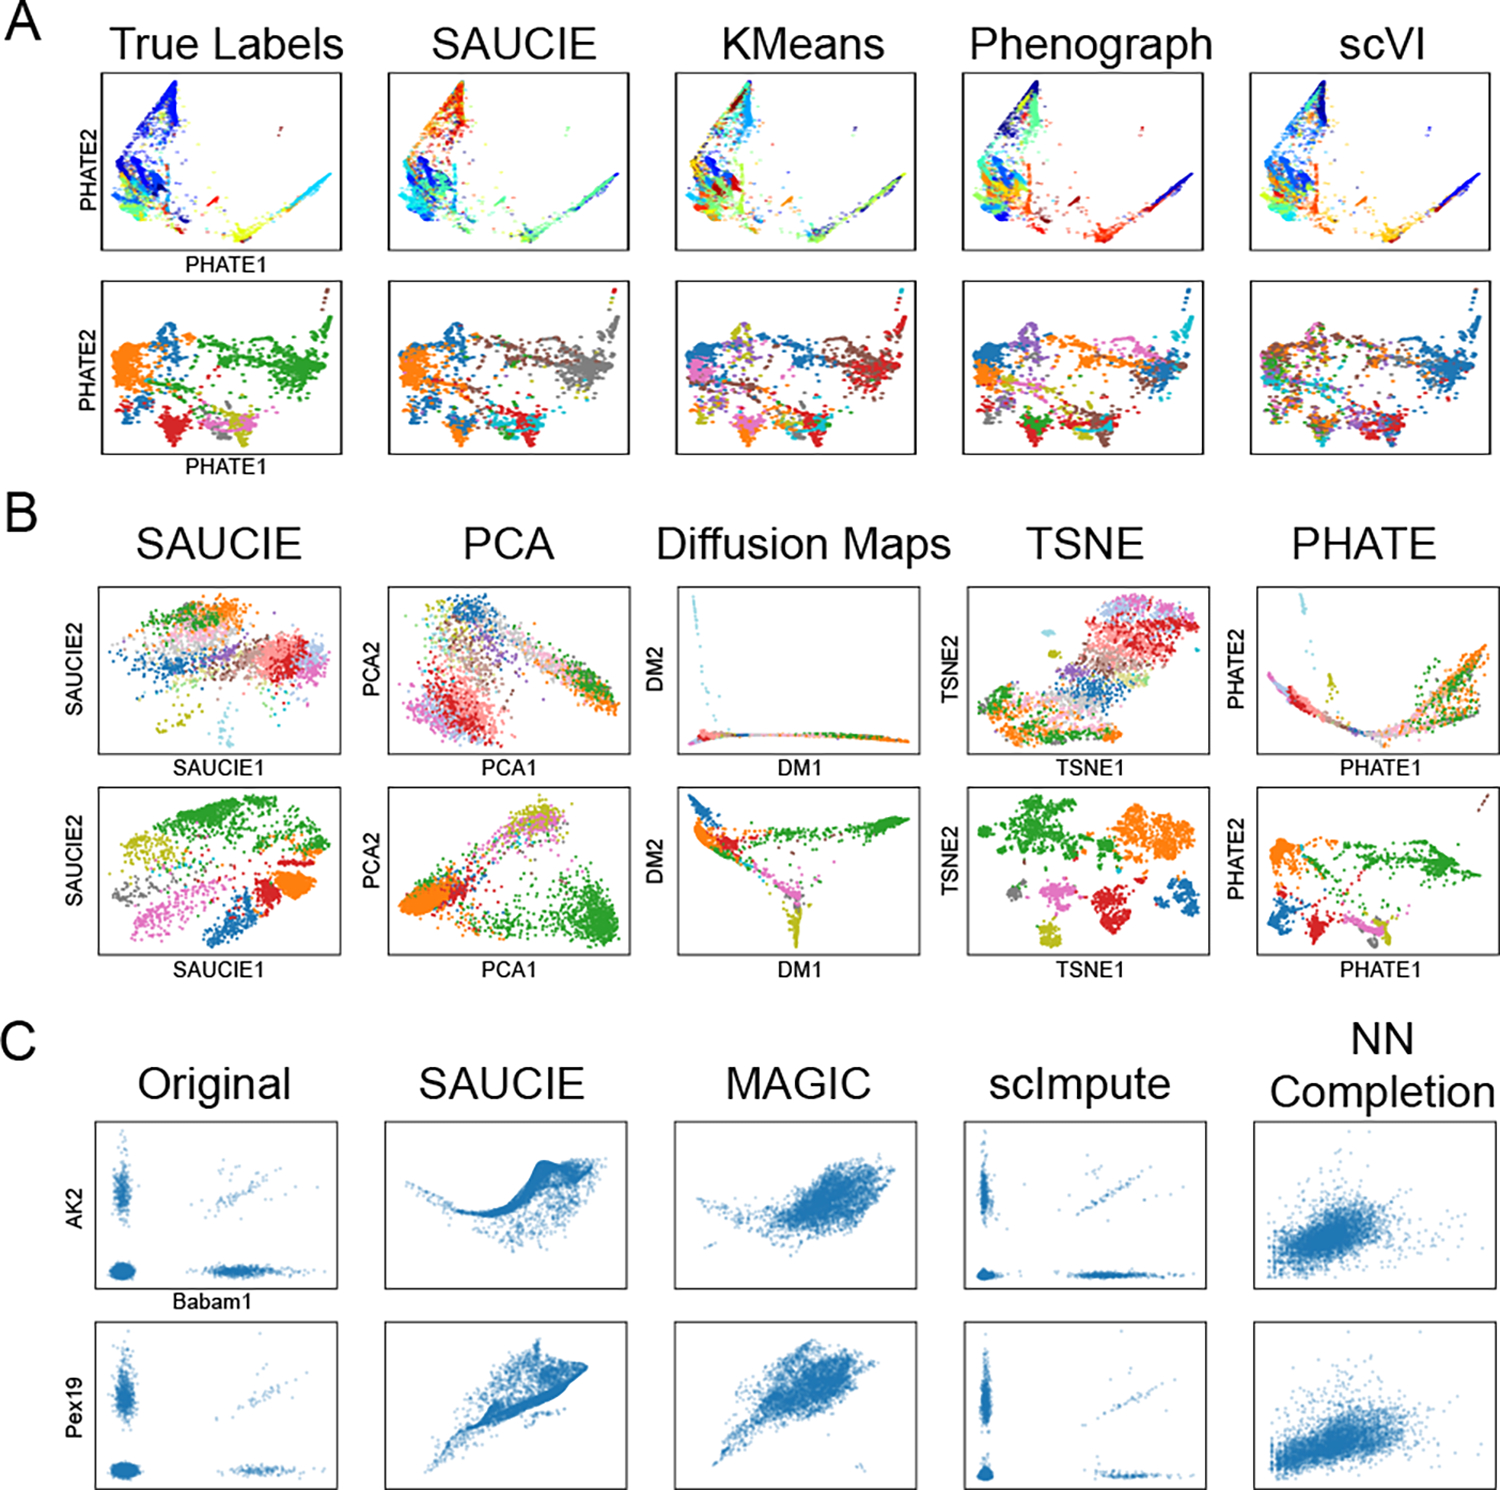
A comparison of the different analysis tasks performed by SAUCIE against other methods. A) A comparison of clustering performance on the data from Shekhar et al (top) and Zeisel et al (bottom) with samples of size 27499 and 3005, respectively. B) A comparison of SAUCIE’s visualization on the same datasets as part (A). C) A comparison of imputation on the 10x mouse dataset subset of size 4142.