
Figure 6.
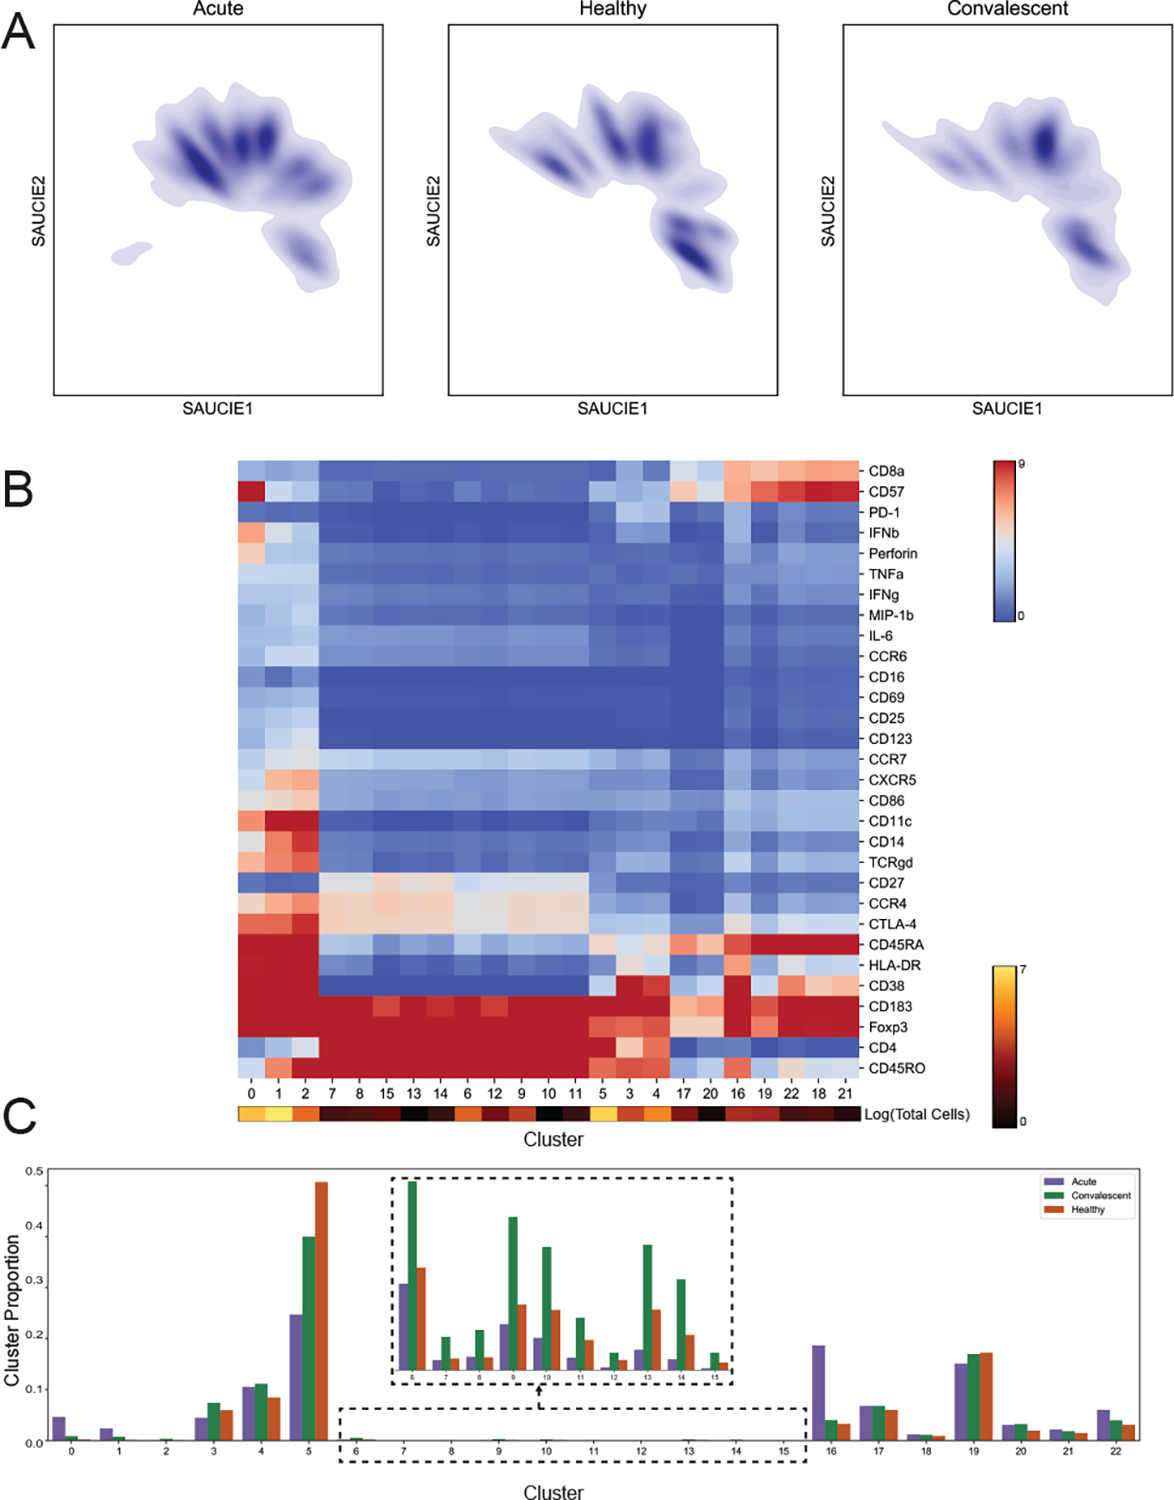
SAUCIE identifies and characterizes cellular clusters, whose proportions can be used to compare patients. SAUCIE on the entire dengue dataset of 11228838 cells. A) The cell manifolds identified by the two-dimensional SAUCIE embedding layer for the T lymphocyte subsets from acute, healthy, and convalescent subjects. B) A heatmap showing clusters along the horizontal axis and markers along the vertical axis. Cluster sizes are represented as a color bar beneath the heatmap. C) Cluster proportions for acute, convalescent, and healthy patients.