Figure 1.
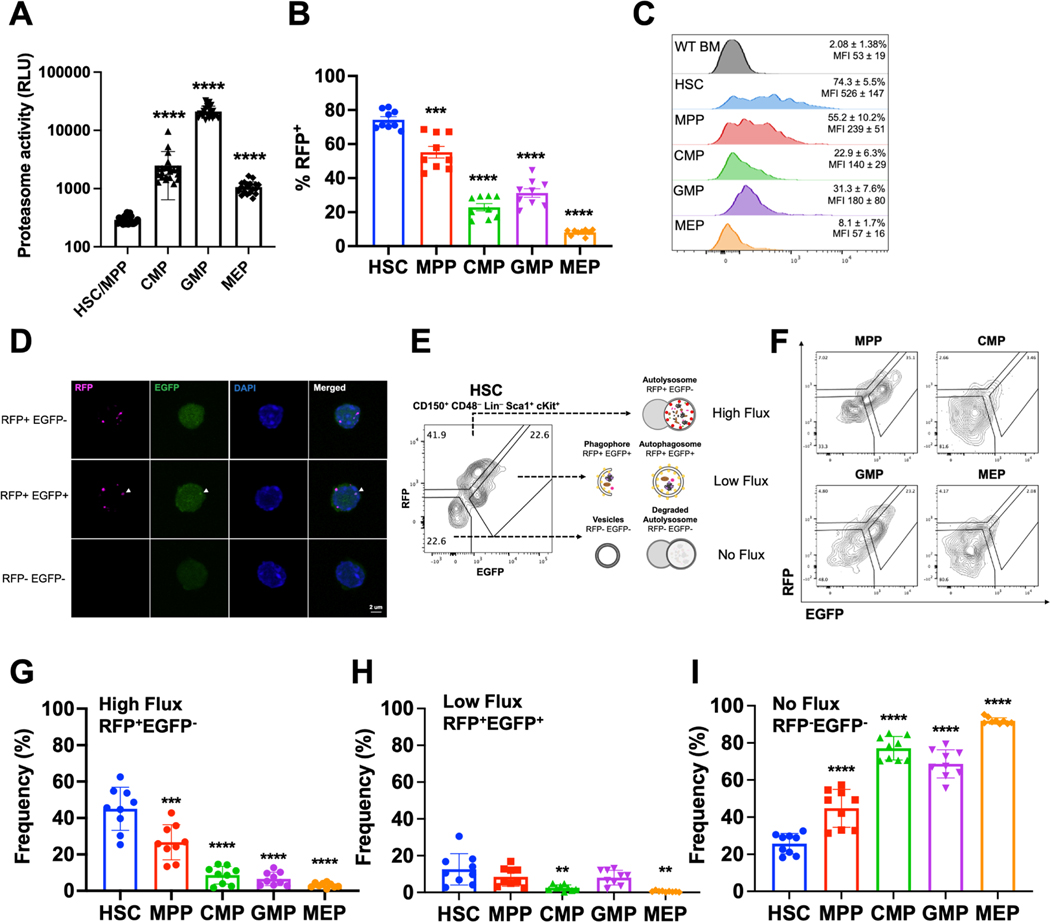
HSCs exhibit high levels of autophagy in vivo.
A. Proteasome activity in HSCs/MPPs (CD48−LSK), CMPs, GMPs, and MEPs measured in relative luminescence units (n=21–22 replicates in 8 experiments).
B. Autophagic activity in HSCs, MPPs, and myeloid progenitors measured by frequency of RFP+ cells in CAG-RFP-EGFP-LC3 mice (n=9 mice from 3 experiments).
C. Representative histograms for RFP expression in bone marrow cells from wildtype mice and HSCs, MPPs, CMPs, GMPs, and MEPs from CAG-RFP-EGFP-LC3 mice (n=9 mice from 3 experiments). Mean frequency and fluorescence intensity of individual mice are shown ± standard deviation (SD).
D. Representative confocal images of FACS isolated RFP+EGFP− (high flux), RFP+EGFP+ (low flux), and RFP−EGFP− (undetectable flux) HSCs.
E-F Flow cytometry gating strategy for identifying high (RFP+EGFP−), low (RFP+EGFP+), and no flux (RFP−EGFP−) autophagy HSCs (E) or progenitors (F) in CAG-RFP-EGFP-LC3 mice.
G-I Frequency of cells undergoing high (G), low (H), and no autophagic flux (I) in CAG-RFP-EGFP-LC3 mice determined by flow cytometry (n=9 mice from 3 experiments).
Data show individual replicates and mean ± SD in A-B and G-I. Data were assessed using a student’s t-test (A) or a one-way ANOVA with Dunnett’s test relative to HSCs (B, G-I). **P≤ 0.01, ***P≤ 0.001, ****P≤ 0.0001.

