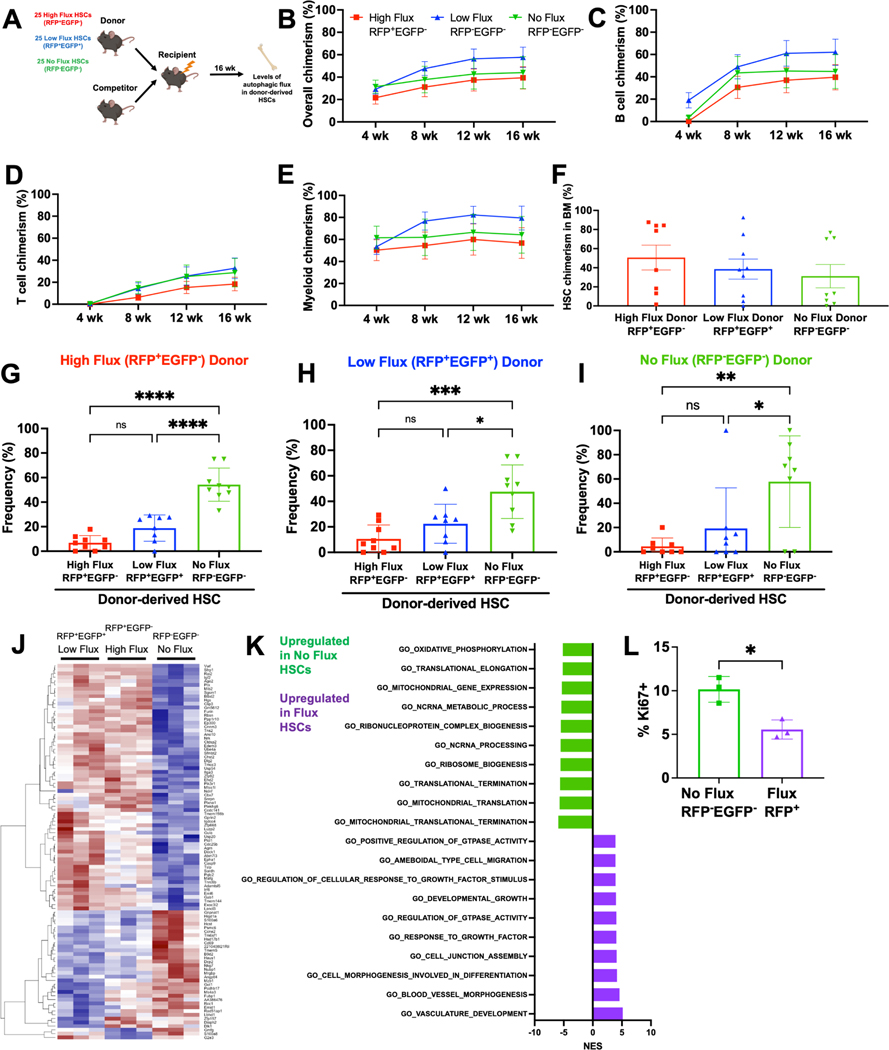
Figure 2.
HSCs dynamically transition between autophagic flux states.
A Schematic for competitive transplantation of RFP+EGFP− high flux, RFP+EGFP+ low flux, and RFP−EGFP− no flux HSCs into irradiated recipients.
B-E Donor hematopoietic (B), B (C), T (D), and myeloid (E) cell engraftment in peripheral blood of mice receiving 25 RFP+EGFP− high flux, RFP+EGFP+ low flux, or RFP−EGFP− no flux HSCs with 3×10⁵ bone marrow cells (n=10–13 recipients/HSC subset in 3 experiments).
F-I HSC engraftment (F) and autophagic activity (G-I) in the bone marrow of mice from transplants in B-E 16 weeks post-transplantation (n=8–9 recipients/HSC subset in 3 experiments).
J Heat map comparing differentially expressed transcripts between RFP+EGFP−, RFP+EGFP+, and RFP−EGFP− HSCs (≥1.5-fold change, Padj<0.05, n=3).
K Normalized enrichment scores from GSEA of most upregulated and downregulated pathways in autophagic versus non-autophagic HSCs.
L Frequency of Ki67+ RFP−EGFP− or RFP+ CD48−LSK HSC/MPPs (n=3).
Data show individual mice (F-I, L) and/or mean (B-I, L) ± SEM (B-E) or SD (F-I, L). Data were assessed by a one-way repeated measures (B-E) or ordinary (F-I) ANOVA followed by Tukey’s test, or student’s t-test (L). *P≤ 0.05, **P≤ 0.01, ***P≤ 0.001, ****P≤ 0.0001.

