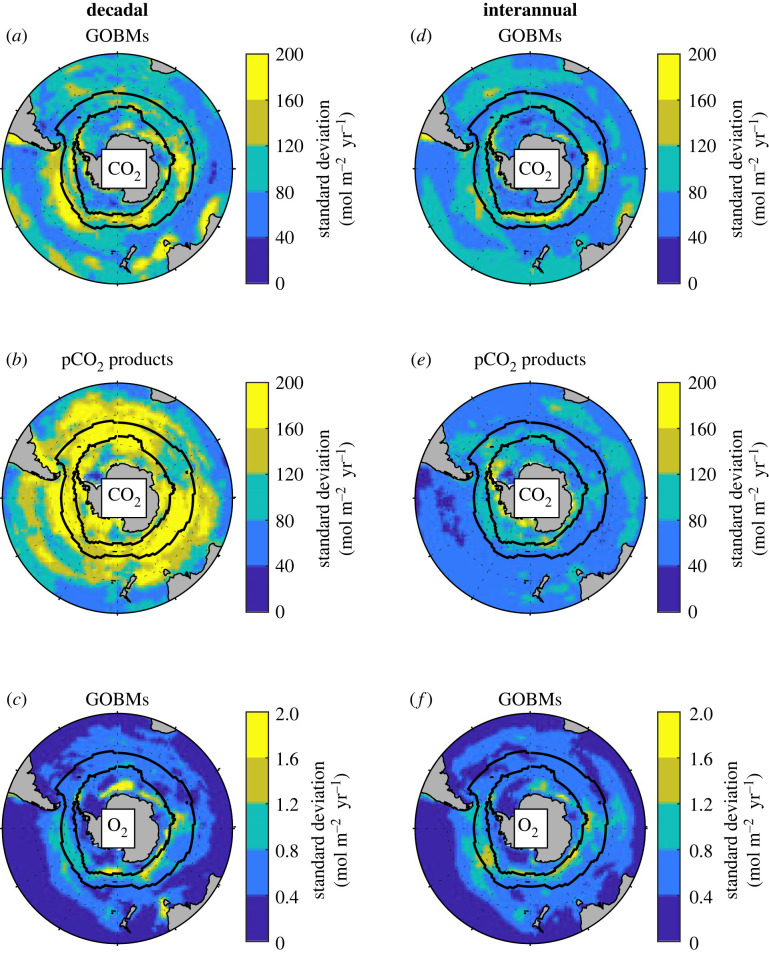
Figure 3.
Standard deviation of the decadal (left) and interannual (right) variability of CO2 and O2 air–sea fluxes. For CO2 (a,b and d,e), the averaged maps from GOBMs and from pCO2 products are shown, while for O2 (c and f) only GOBMs could be used to study the spatial patterns. Note the differences in units and colour scales between O2 and CO2 maps. The black lines represent the average location of the Subantarctic Front (northern line) and of the September extent of sea ice (southern line). Maps from individual GOBM and pCO2 product are available in the electronic supplementary material (figures S1–S6). (Online version in colour.)

