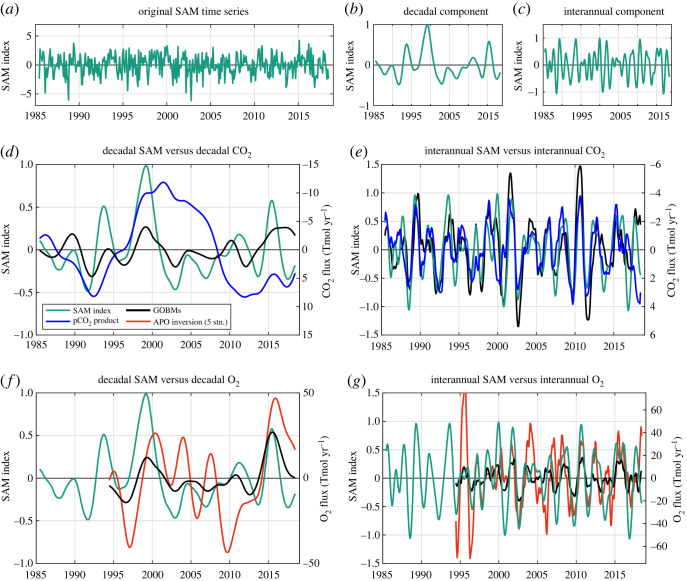
Figure 5.
Comparison of the SAM index and the climate-driven variability of CO2 and O2 air–sea fluxes from the GOBM mean, pCO2 product mean and APO inversion. (a) The detrended time series of the SAM index, which has been decomposed into (b) a decadal component and (c) an interannual component, and compared with the decadal and interannual components from CO2 (d and e, the right-hand axes are inverted) and O2 (f and g) air–sea fluxes. Fluxes are defined as positive from the atmosphere into the ocean. (Online version in colour.)

