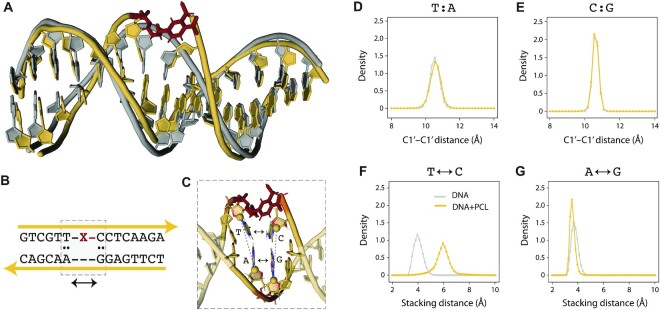
Figure 2.
Molecular dynamics simulation of a PCL-containing duplex. (A) Representative structures from MD simulation of the DNA duplex with (yellow) and without PCL (gray). PCL is shown in red. (B) Sequence identity of the DNA construct. The nucleotides adjacent to the PCL are highlighted by the dashed box. (C) Structural details of the nucleotides adjacent to the PCL. The C1′ atoms are shown as spheres. (D) Distribution of the C1′-C1′ distance for the base pair 5′ adjacent to the PCL (yellow) and the same base pair in the construct without PCL (gray). (E) Distribution of the C1′-C1′ distance for the base pair 3′ adjacent to the PCL (yellow) and the same base pair in the construct without PCL (gray). (F) Stacking distance distribution for the nucleotides 5′ and 3′ adjacent to PCL on the toehold-containing strand. (G) Stacking distance distribution for the nucleotides 5′ and 3′ adjacent to PCL on the invading strand. All distance distributions are averages from three independent simulations (50 ns each). Error bars in panels D-G represent standard deviations from these triplicates.

