Figure 4.
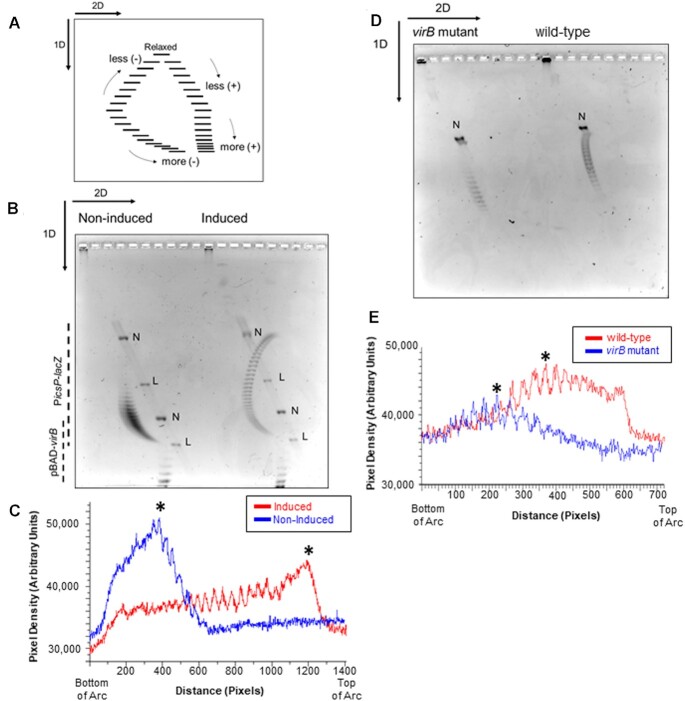
Analysis of PicsP-lacZ topoisomer distribution using two-dimensional agarose gel electrophoresis in E. coli and S. flexneri. (A) Schematic of two-dimensional agarose gel electrophoresis used to analyse topoisomer distributions (adapted from (96)). In the first dimension, the fast-migrating topoisomers are more negatively supercoiled while the slow-migrating topoisomers are less negatively supercoiled. In the second dimension, the fast-migrating topoisomers are increasingly positively supercoiled. (B) Two-dimensional gel electrophoresis of PicsP-lacZ reporter isolated from E. coli with or without virB induction during growth. Two independent trials were performed, representative data are shown. (C) Lane trace analysis of topoisomers shown in panel B. Asterisk represents most intense topoisomer in each trace. (D) Two-dimensional gel electrophoresis of PicsP-lacZ reporter isolated from wildtype Shigella or an isogenic virB mutant derivative. Two independent trials were performed, representative data are shown. (E) Lane trace analysis of topoisomers shown in panel (D). Asterisks represent the most intense topoisomers in each trace (representative analysis shown) [N = nicked and L = linear]. Arcs used for gel quantification are provided in Supplementary Figure S7.

