Figure 2.
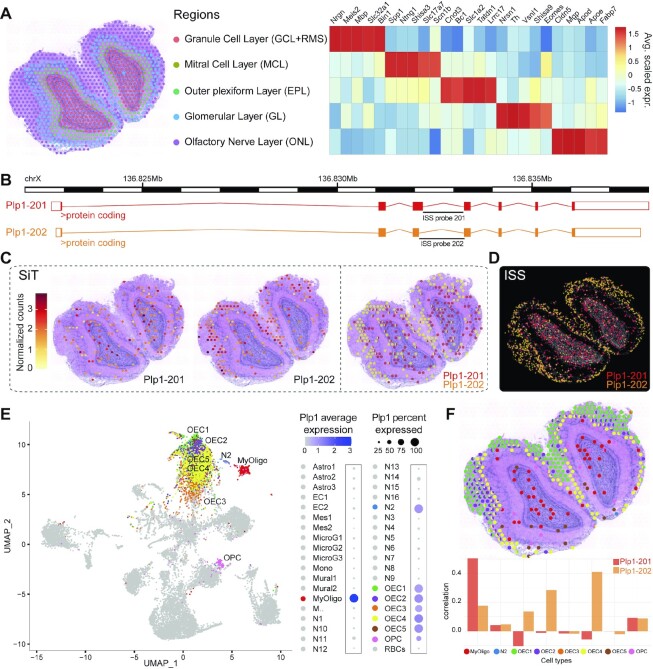
SiT reveals isoform switches in the mouse olfactory bulb. (A) Data-driven annotation (left panel) of mouse olfactory bulb spatial regions through transcriptome-clustering of short-read data. Heatmap shows the expression of prominent marker genes for each region. (B) Exonic structure of the different Plp1 isoforms (mm10 genome build) detected by SiT. (C, D) Expression of Plp1 isoforms detected by SiT (C) and ISS (D). (E) Uniform Manifold Approximation and Projection (UMAP) representation of an external MOB single cell dataset (27). The dot plot on the right indicates Plp1 expression per cell type in the single cell dataset. (f) Spatial spot deconvolution of cell types with high/prominent Plp1 expression. Each dot corresponds to a pie graph indicating cell type composition in this spot (upper panel). Per spatial spot correlation observed between deconvolution score and Plp1 isoform expression (lower panel). Results show that Plp1 is predominantly expressed by olfactory ensheathing cells (OEC) in the olfactory nerve layer (ONL) and by myelinating-oligodendrocytes (MyOligo) in the granule cell layer (GCL).

