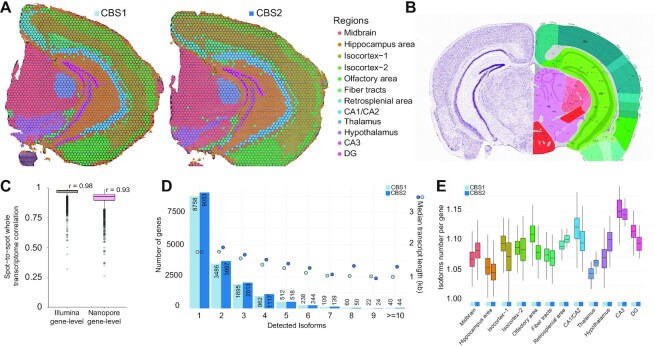
Figure 3.
SiT robustness assessment using two coronal brain sections. (A) Data-driven annotation of two mouse coronal brain regions through transcriptome clustering of short-read data. (B) Allen Mouse Brain Atlas reference map for the coronal brain section region annotation. (C) Gene-level short-read and long-read transcriptome correlation between corresponding spatial spots of the CBS1 and CBS2 section after image alignment and distance minimization. (D) Histogram showing the frequency distribution of the number of isoforms per gene for CBS1 and CBS2. The median length of transcripts is indicated for each category. (E) Average number of isoforms per gene detected for each spatial region.

