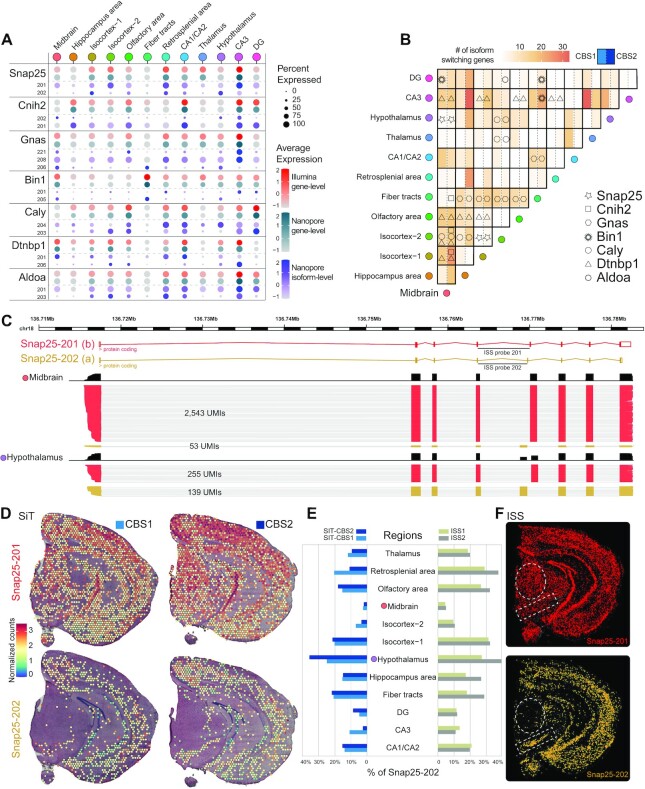
Figure 4.
SiT reveals Snap25 isoform-switch between mouse brain regions. (A) Dotplot showing the seven most significant (adjusted P-value < 0.05) regional differences in isoform usage detected in CBS1 and CBS2 sections (CBS2 expression value is shown). (B) Heatmap illustrating the number of isoform-switching genes identified for each pair of brain regions (same order for the horizontal and vertical axes). Genes discussed in this study are highlighted with symbols when differential transcript usage was called for CBS1 (left part) and/or CBS2 (right part) for each pair of regions. (C) Snap25 isoforms (alternative exon 5) tracks and number of molecules (UMI) observed in Midbrain and Hypothalamus (CBS2). (D) Snap25 isoform expression in coronal brain sections revealed by SiT. (E) Contribution of Snap25-202 to the total expression of Snap25 in different brain regions for two independent replicates of SiT (left) and ISS (right). (F) Snap25 isoform expression validation by in situ-sequencing (ISS).

