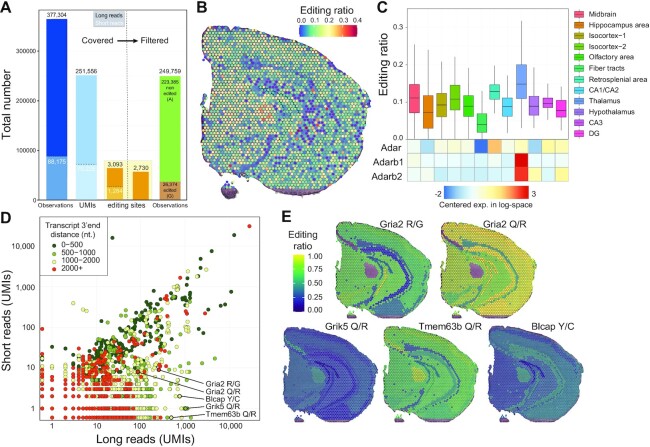
Figure 5.
SiT reveals spatial variations in A-to-I RNA editing in the mouse brain. (A) Histogram showing the sum of known exonic editing site observations (Observations, blue bars), the total number of unique UMIs covering at least one editing site (UMIs, light blue bars), the number of unique editing sites covered by at least one UMI (orange bars) by long-read (black numbers) and short-read (white numbers) data before (left part) and after (right part) quality filtration of Nanopore UMIs (consensus sequence quality ≥6 and UMI sequencing depth ≥3, see Supplementary Figure S13). (B) Spatial map of A-I editing ratios. (C) Editing ratio and gene-level expression of ADAR enzymes per region. (D) Editing site short- and long-read coverage colored by distance to transcripts 3′-end. (E) Spatial map of the A-I editing ratio for a selection of editing sites. Editing ratios were computed as the average editing ratio of molecules observed per region.

