Figure 3.
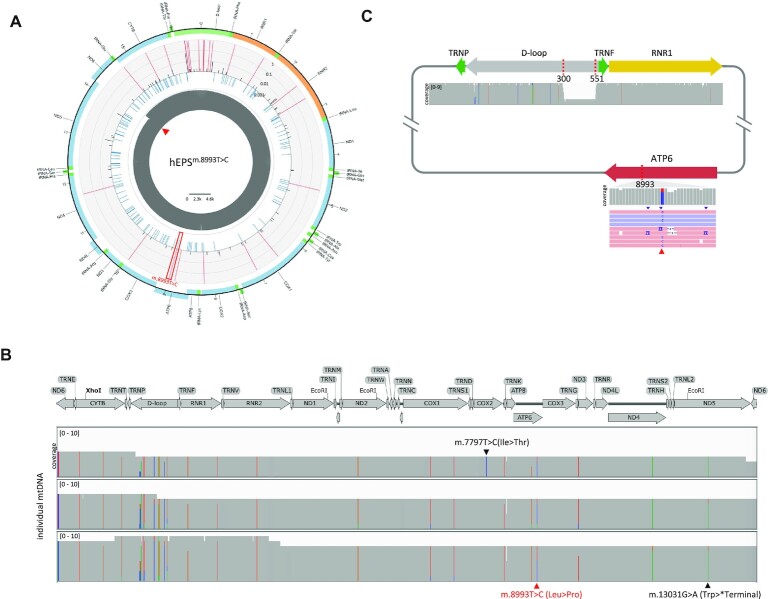
iMiGseq of patient derived hEPSm.8993T>C cells. (A) Circular plots showing the distribution of SNVs in the mitochondrial genome of hEPSm.8993T>C. The arrangement of the circular plot is similar to Figure 1D and the m.8993T > C mutation is indicated by the red frame. (B) Sequential acquisition of detrimental mutations illustrated by Integrative Genomics Viewer (IGV) plots. Three UMI groups (mtDNA) with the same pathogenic m.13031G > A mutation (indicated in black under the plot) are shown. The putative disease-causing mutation of m.8993T > C is indicated in red under the plot. A de novo m.7797T > C mutation is found in one UMI group and indicated in black above the plot. (C) A schematic map of the mutant mtDNA harboring the 251-bp deletion and m.8993T > C mutation detected in hEPSm.8993T>C and the accompanying IGV tracks showing the alignment of Nanopore reads. The read triangle shows the position 8993 in the reads.

