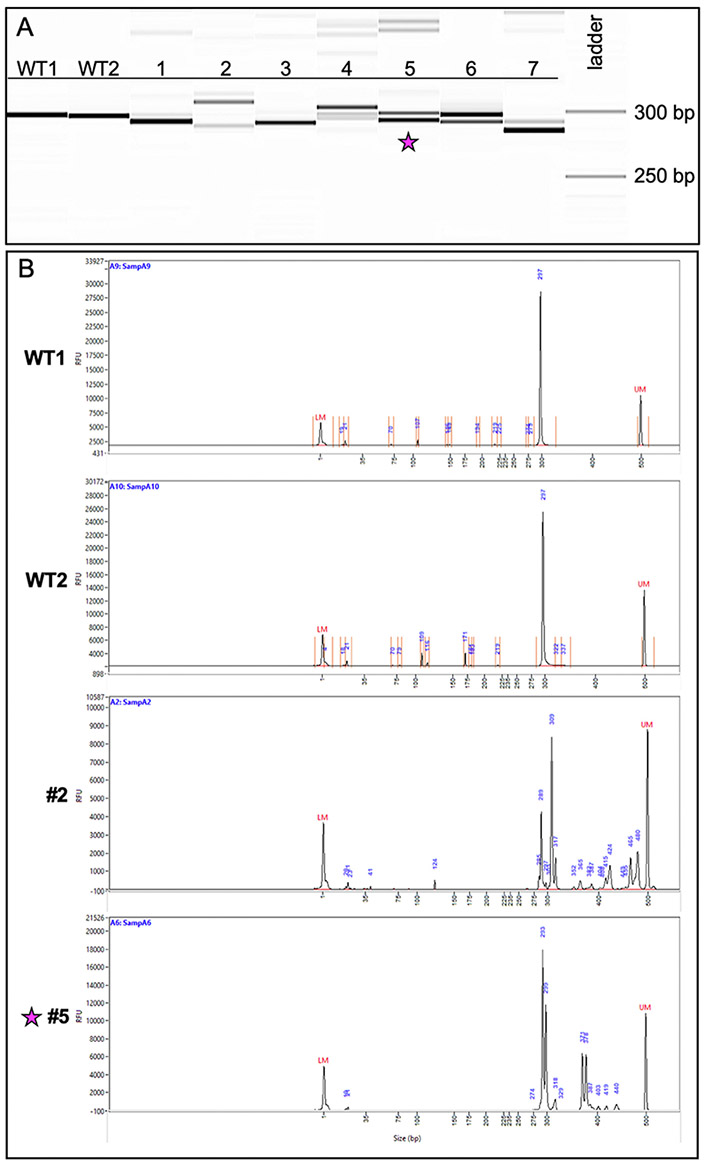
Fig. 4.

Genotyping of CRISPR-injected F0 adults reveals a variety of indel species. (A) Image of the fragment analyzer gel output data. The first two lanes (WT1, WT2) are wildtype fish and display a band size of 297 bp. Lanes 1–7 are fish from the CRISPR-injected adult F0 generation. (B) Image of the electropherograms for samples WT1, WT2, 2, and 5. The taller peaks correspond to the more intense bands on the gel. The peaks for #2 (289 bp and 309 bp) suggest the presence of two primary amplicons present in a high percentage of the gDNA: one with a potential 8-bp indel and the other a potential 12-bp indel. Less prevalent amplicons exist at larger bp sizes ranging between 317 and 480 bp. The peaks for #5 (293 bp and 299 bp) suggest the presence of a predominant 6-bp indel. Fish #5 (indicated with a star) was successfully bred and used to establish a stable mutant line.
