Figure 6.
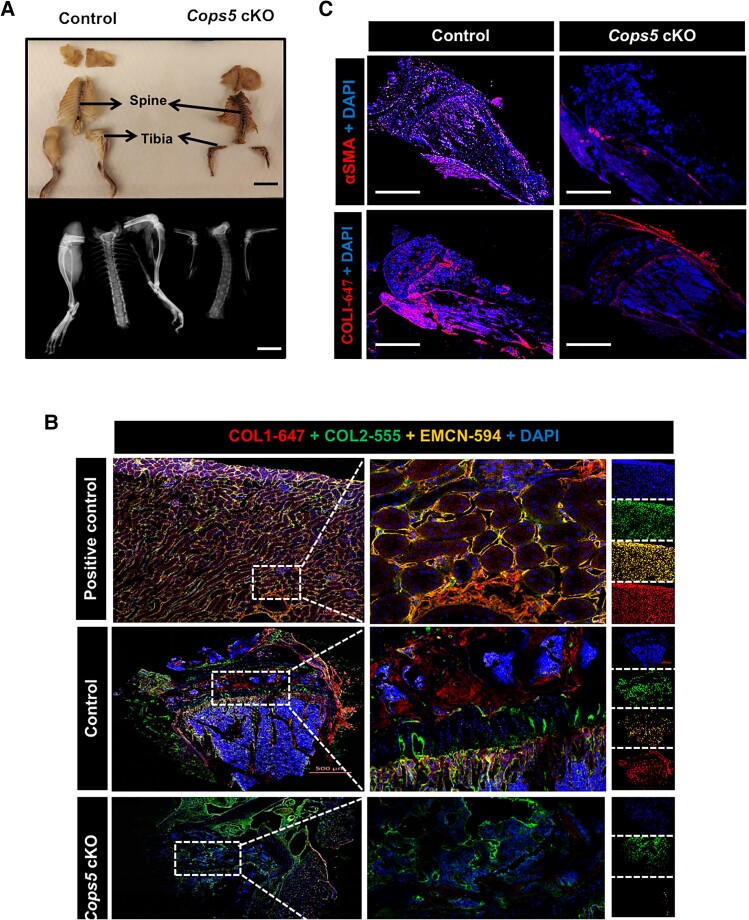
Impaired skeletal development of Cops5 cKO mice. (A) Representative images showing the variation of the length and width of the tibia between the control and Cops5 cKO mice. Bar = 2 cm (upper panel); bar = 8 mm (lower panel). (B) Immunofluorescence images showing reduced expression of EMCN and COL1 in the tibia of Cops5 cKO mice. (C) Immunofluorescence images showing decreased α-SMA and COL1 in the tissues around the tibia of Cops5 cKO mice. Bar = 1000 μm.

