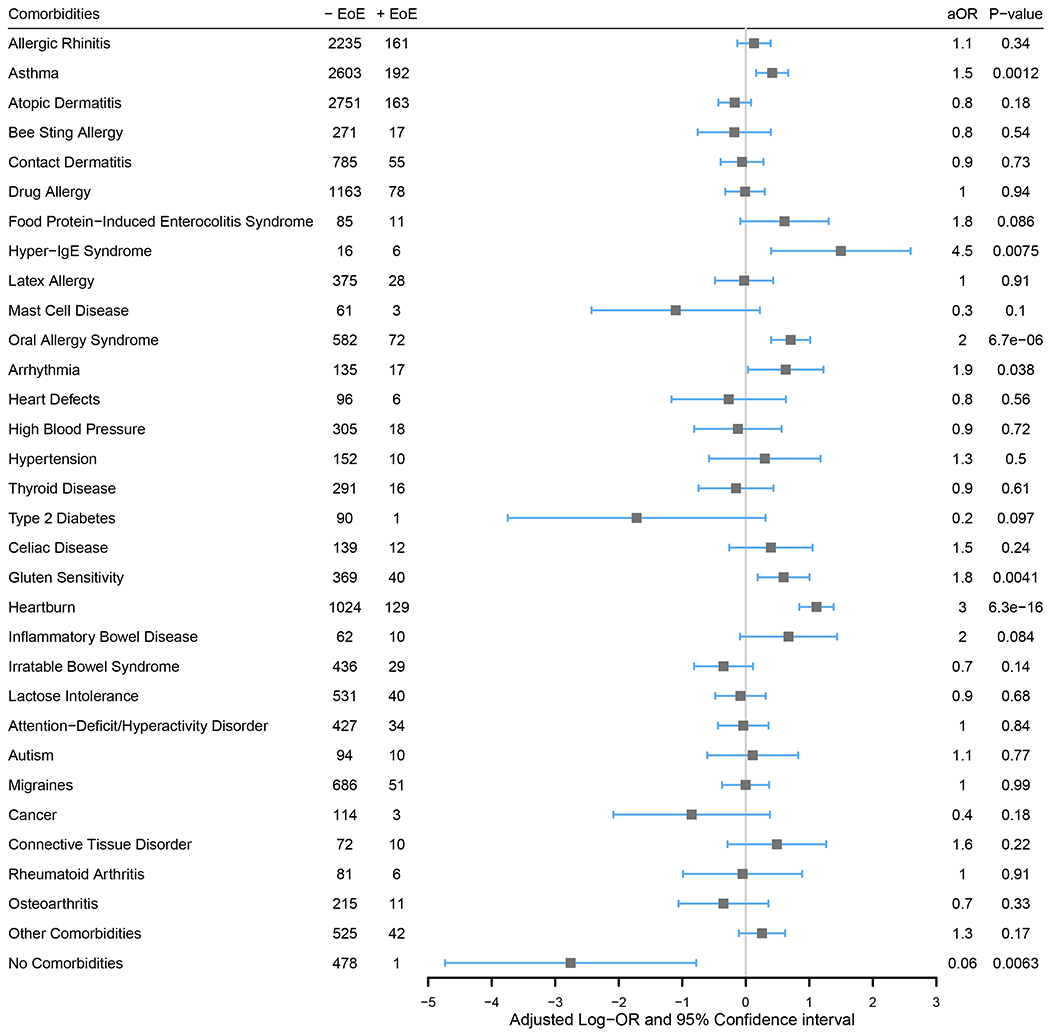
Figure 2. Independent associations between comorbidities and reported EoE.

An adjusted OR (aOR) above 1 (equivalent to an adjusted log-OR above 0; gray line) denotes a higher odds of reporting EoE. One multivariable logistic regression model with all 32 shown comorbidity categories was fit while also controlling for sex, age, race, ethnicity, and geographic location.
