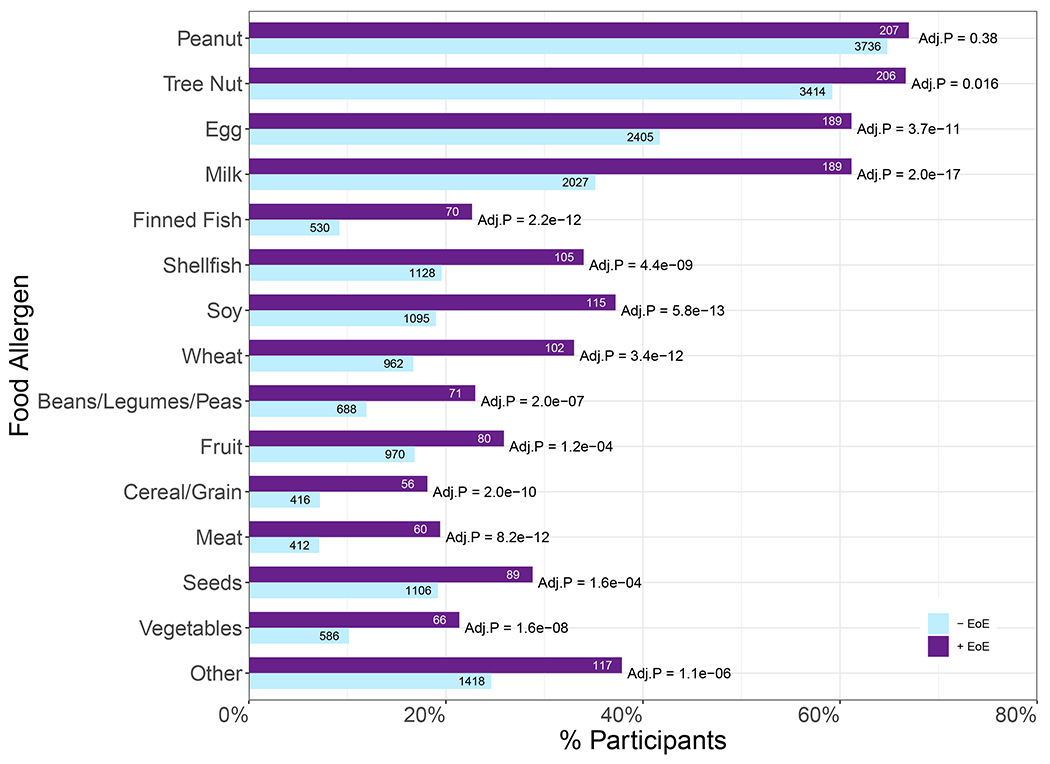
Figure 3. Percentage reporting allergies to the major food allergen categories.

Percentage of participants in the −EoE (n=5,765) and +EoE (n=309) subsets that reported allergy to the major food allergen categories or “Other” food allergen. For each food allergen category, a multivariable logistic regression model was fitted adjusting for demographic data (sex, age, race, ethnicity, and geographic location). FDR-adjusted P-values are shown.
