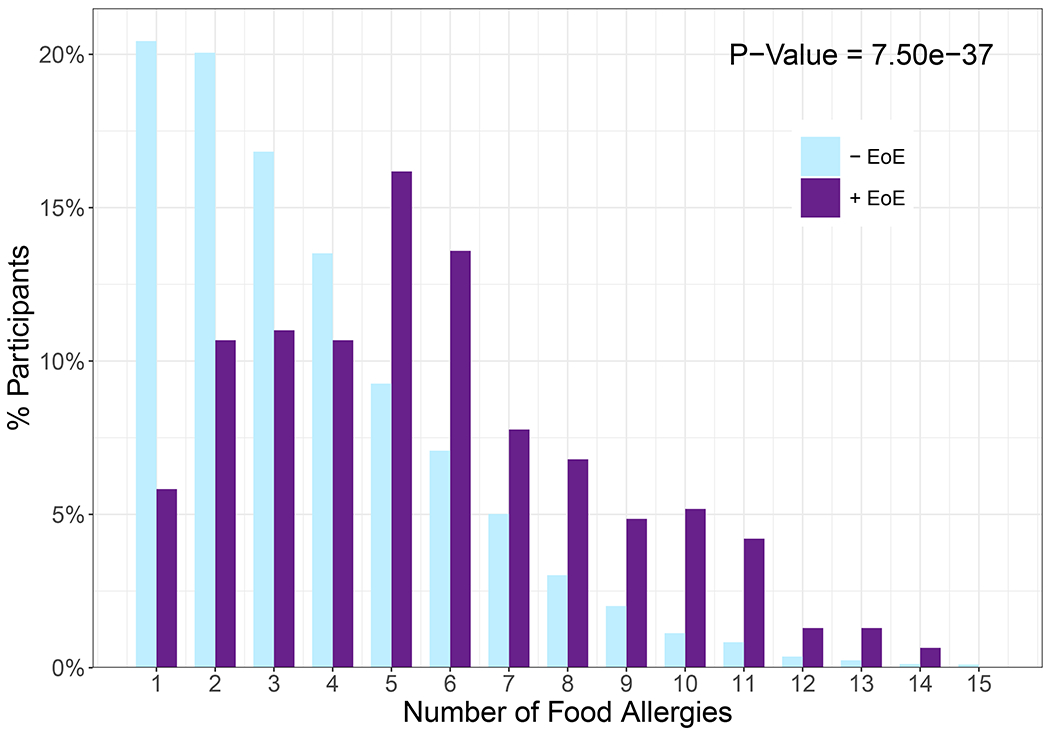
Figure 4. Number of major food allergies.

The percentage of each study population reporting n number of allergies to the major food allergen categories or “Other”. The mean number of food allergies for the −EoE and +EoE subsets is 3.62 and 5.57 respectively (aOR=1.3, 95% CI: 1.23-1.32). Significance and odds ratio determined by multivariable logistic regression with adjustment for demographics.
