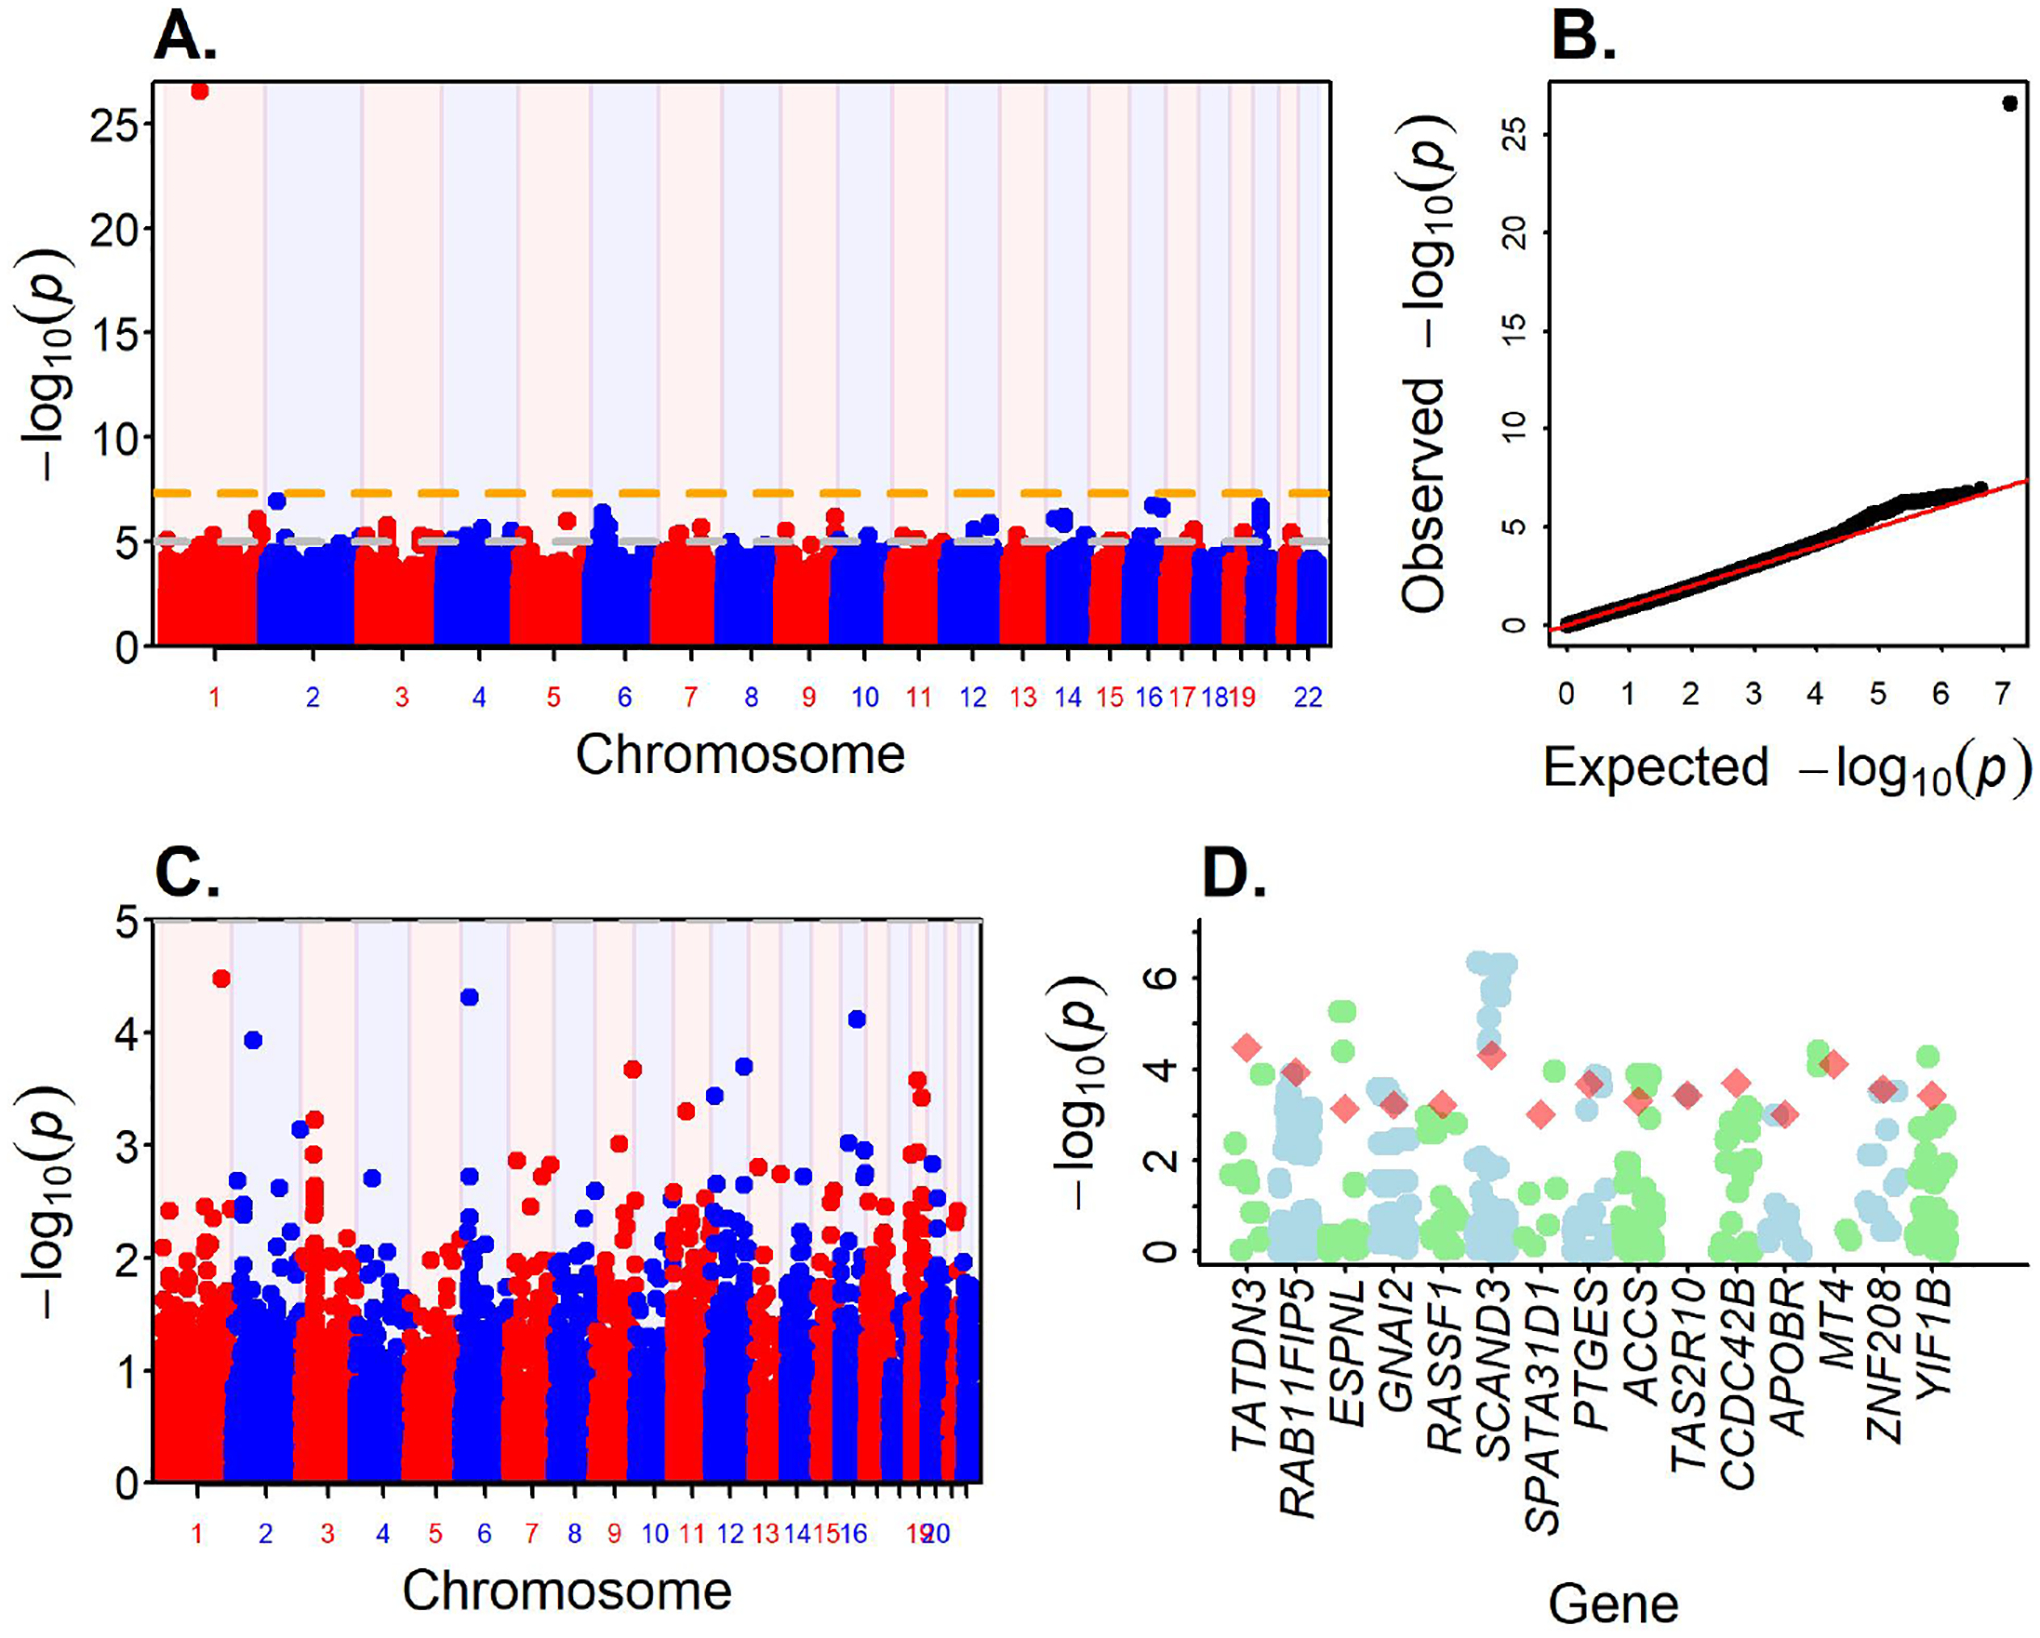
Figure 3.

GWAS result of EoE in African Americans. A. Manhattan Plot shows the association of SNPs across genome. Red horizontal line marks the GWAS significance level p-value = 5e-8. B. QQ plot (genomic control lambda = 1.009). C. Gene association results from FUMA. D. Fifteen genes with p-value < 0.001 from the gene association test. For each gene, variants within ± 500 bp were identified from the GWAS data and the p-value are shown along with the p-value of the gene.
