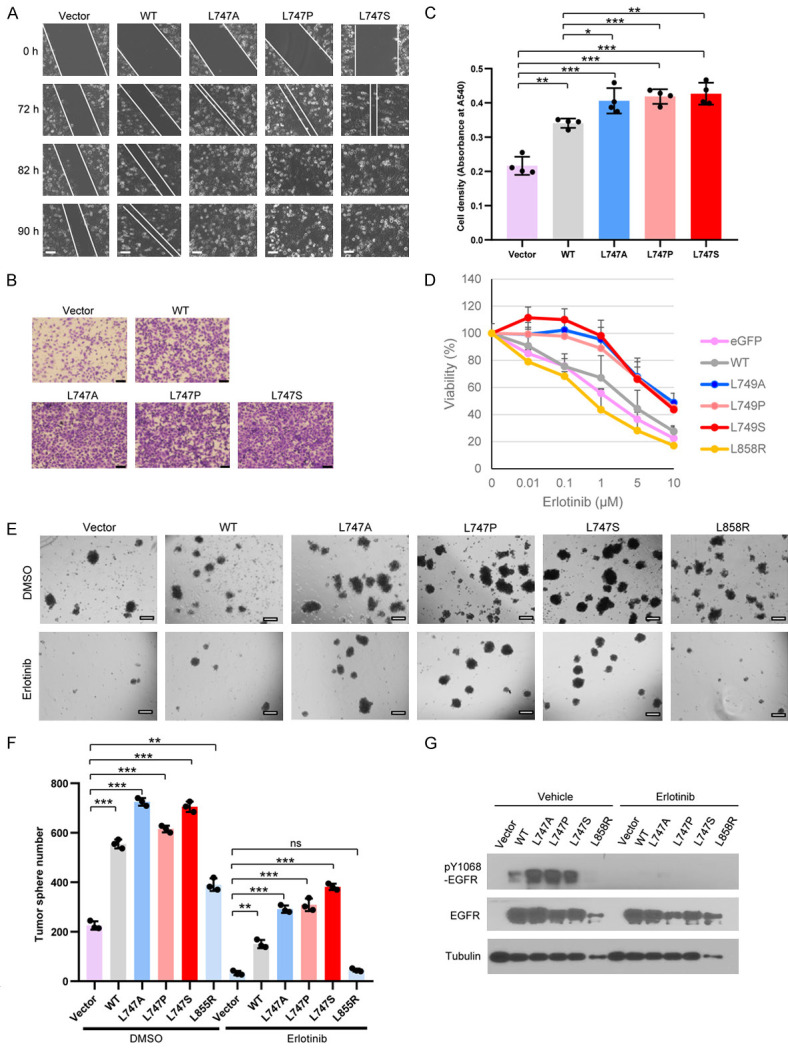
Figure 4.

Expression of EGFR NES mutants enhances migration, invasion, and TKI resistance. (A) Cells expressing the indicated plasmids were seeded in a 6-well plate. Live microimaging of wound healing was performed using Cell Observer Microscopy (ZEISS). Bar, 100 µm. (B) H1299 cells (1 × 10⁴) expressing the indicated plasmids in culture medium without serum were seeded into the invasion chambers coated with Matrigel. The chambers were inserted into 24-well plates filled with 10% fetal calf serum-containing medium. The cells were cultured for 48 h before fixation and staining with crystal violet. Bar, 200 µm. (C) Quantitative analysis of the invasive potential of the lung cancer cells expressing EGFR WT and NES mutants. Bar graphs were presented as the mean value ± SD of four independent experiments. (D) Cells expressing the indicated plasmids were seeded in 96-well plates at 3,000 cells/well and allowed to grow overnight. Erlotinib at the indicated concentrations was added and was replaced with new medium containing erlotinib at 36 h. The viable cells were determined by Trypan Blue staining. Each point was triplicated. The curve data represented were the mean values from at least two independent experiments. (E) A tumor spheroid formation assay was performed in H1299 cells expressing the indicated plasmids in the presence of erlotinib (2.5 μM) or vehicle DMSO for 12 days. Bar, 100 μM. (F) Bar graphs of tumorsphere numbers are presented as the mean value ± SE of three independent experiments. (G) Whole lysates of the tumorspheres in the presence and absence of 2.5 μM erlotinib, isolated from the Matrigel 3D sphere cultures (E), were immunoblotted with the indicated antibodies. ns, not significant, *P < 0.05, **P < 0.01, ***P < 0.001.
