
Figure 3.
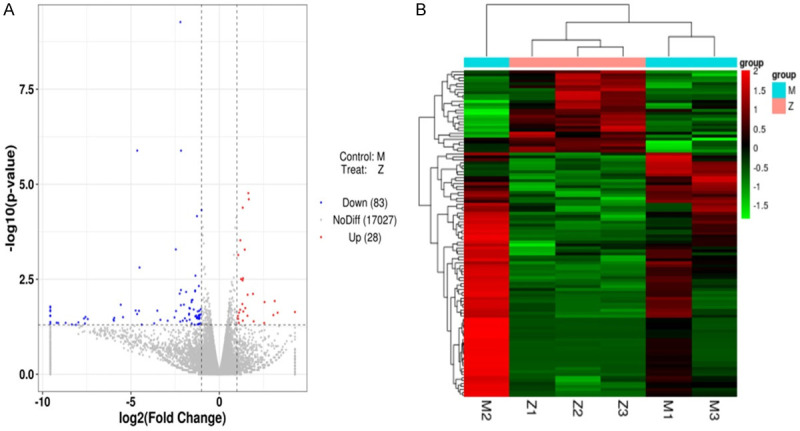
Transcriptome sequencing to analyze the molecular mechanism of XHP in BC. A. Volcano plots of the DEGs were drawn with the R language ggplots2 package. B. The heat map of the DEGs from mouse tumour tissues treated with or without XHP (control group) was generated using the pheatmap package in R language software.