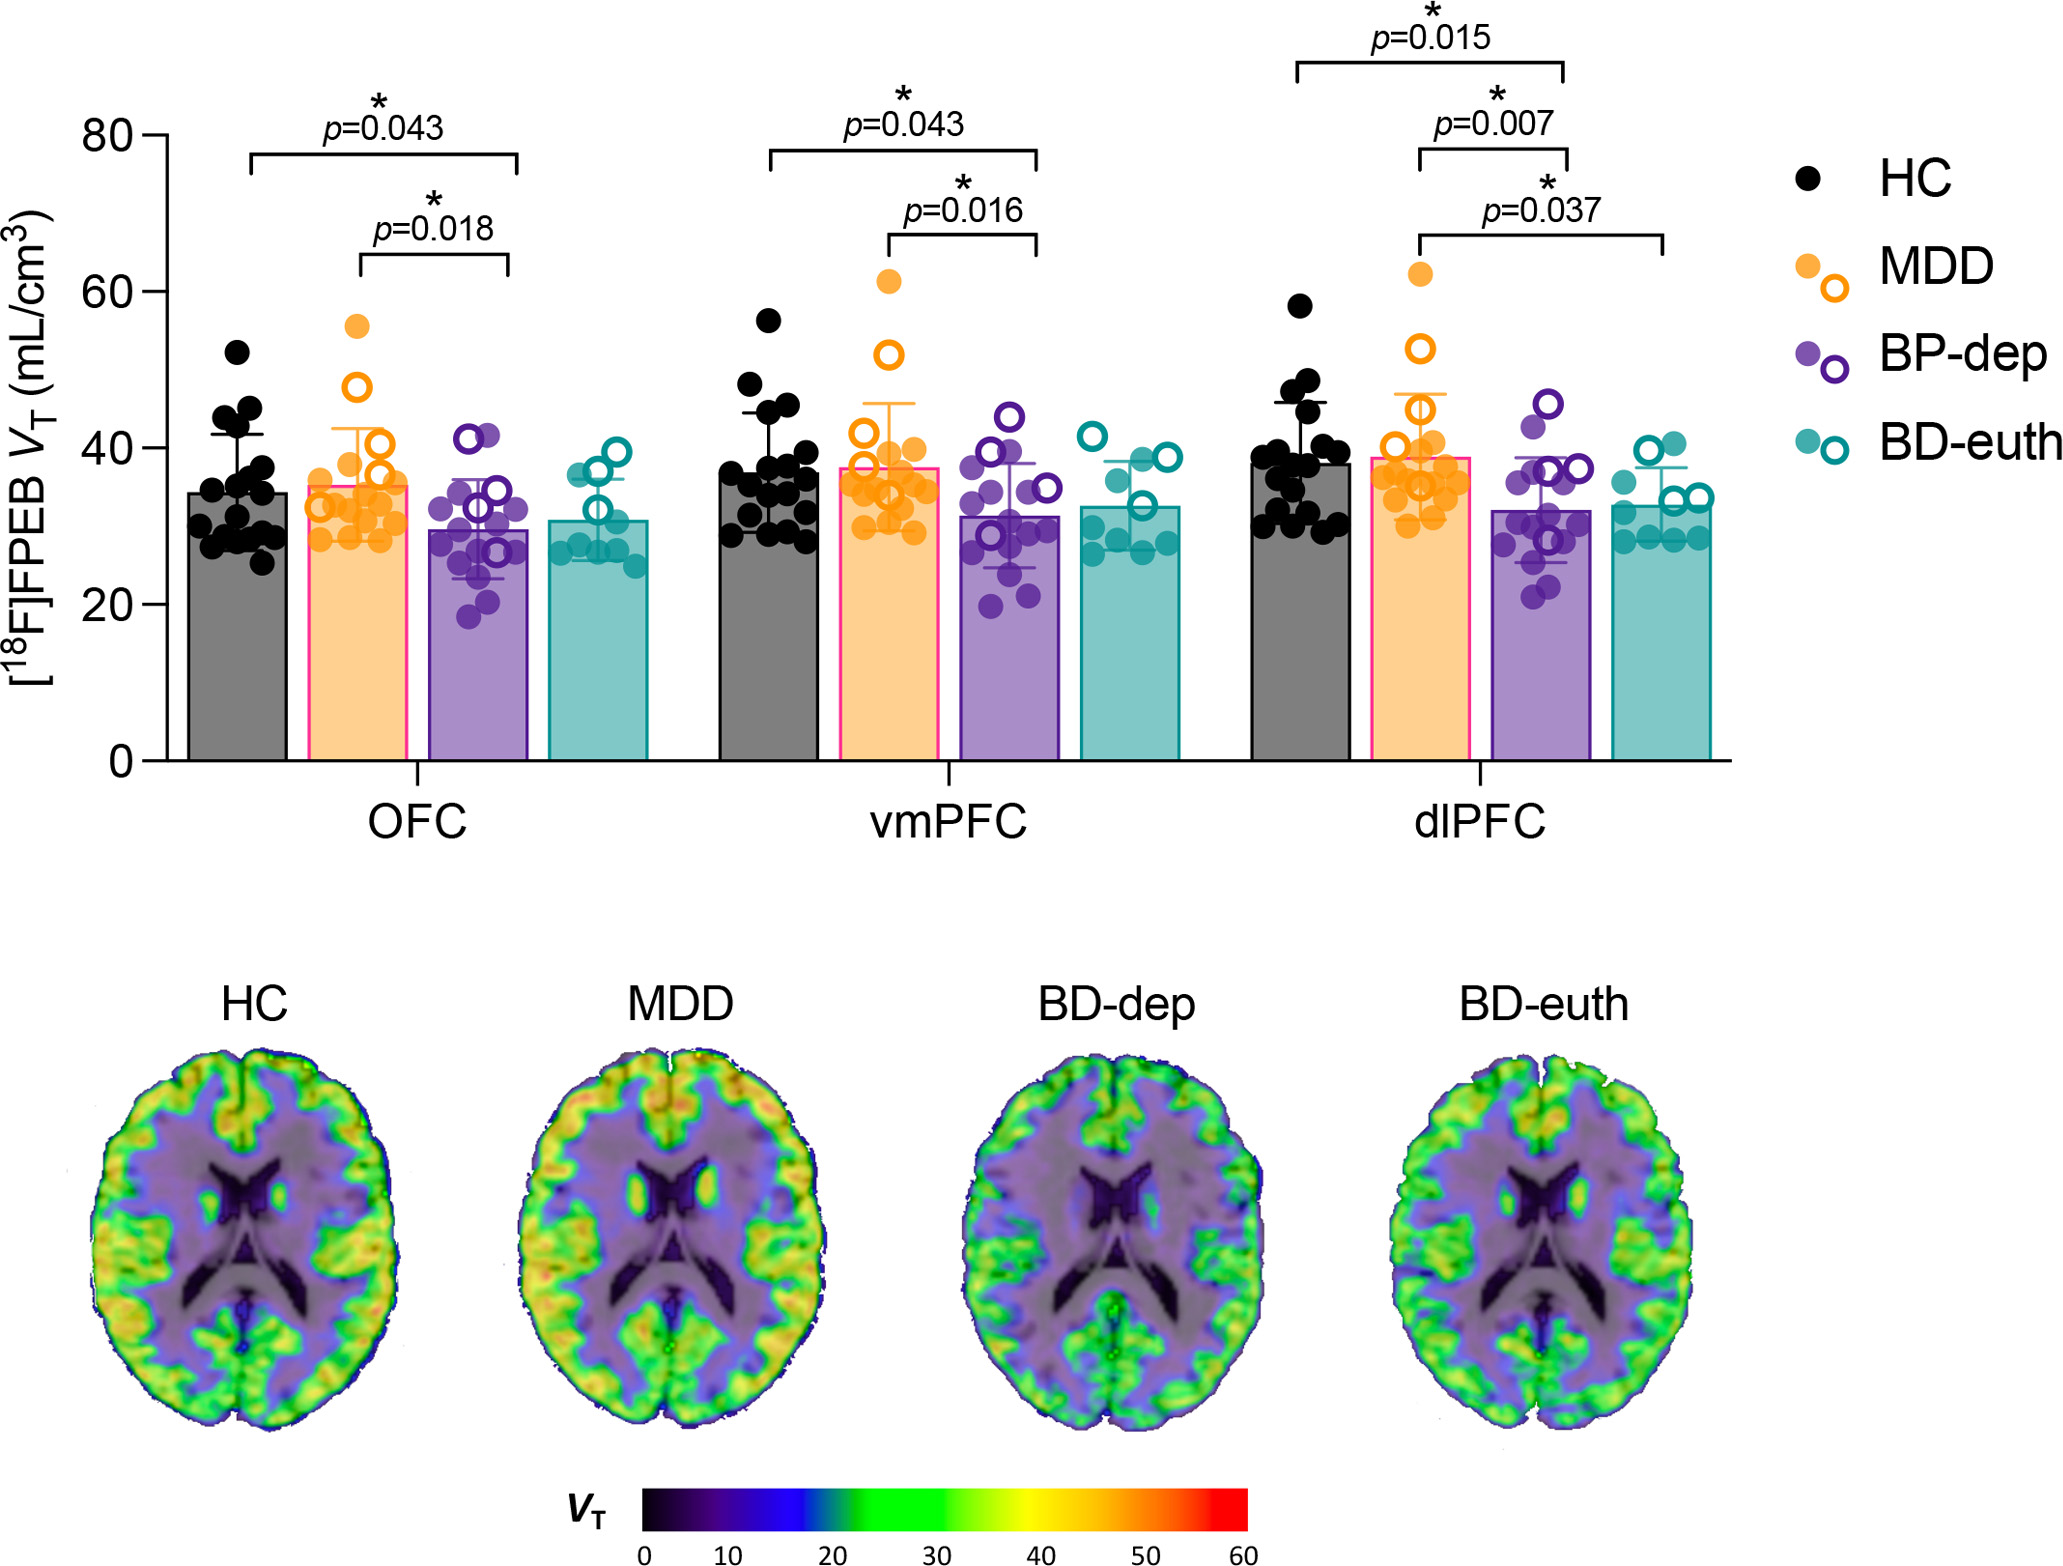
Figure 1.

MANOVA of [18F]FPEB VT within PFC subregions across HC (black), MDD (orange), and BD-dep (purple) and BD-euth (teal) groups. Brackets indicate p-values from independent-sample t-tests. Closed circles represent unmedicated subjects, and open circles indicate subjects taking any psychotropic medication (see table S1). Brain images are parametric [18F]FPEB VT images overlaid on structural MRI in template space from representative HC, MDD, BD-dep and BD-euth individuals.
