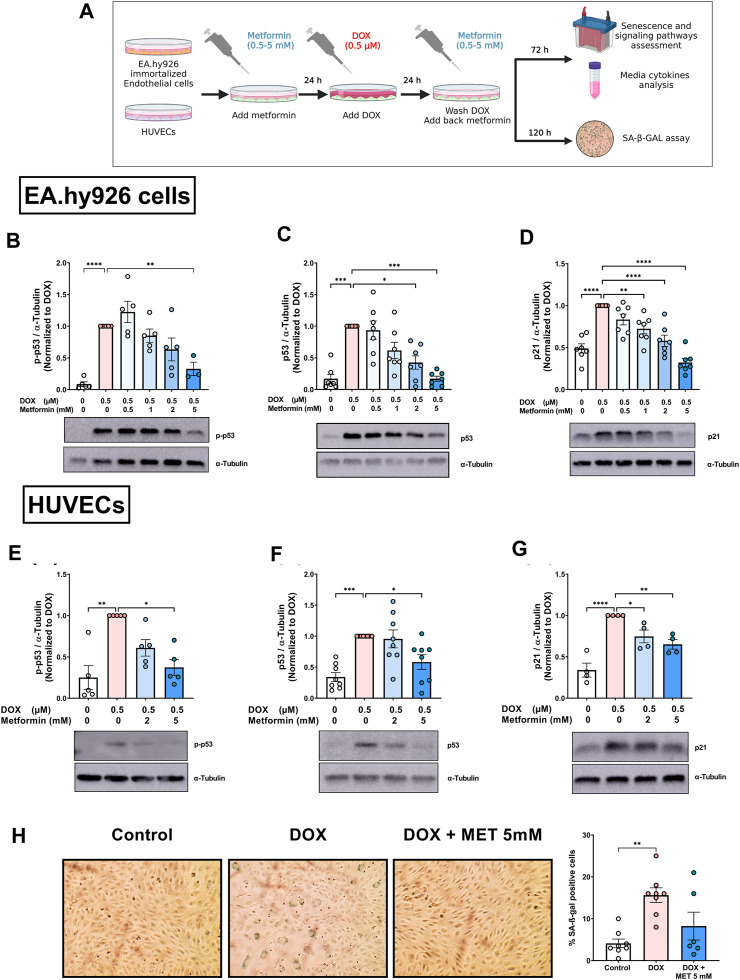
FIGURE 1.
Metformin inhibited DOX-induced upregulation of senescence markers and SA-β-gal activity in endothelial cells. (A) Schematic diagram of the experimental design. Both EA.hy926 endothelial derived cells and HUVECs were treated for 24 h with 0.5 µM DOX ± metformin (0.5–5 mM, added 24 h before DOX). Thereafter, DOX was removed and the cells were incubated in DOX-free media with or without metformin for an additional 72 h for protein expression experiments or 120 h for measurement of SA-β-gal staining. Expression levels of senescence markers including p-p53, p53, and p21 in EA.hy926 cells (B–D), and HUVECs [(E–G), respectively] were measured using western blot (n = 4–8). Representative images of western blots are shown. Values were normalized to α-tubulin and expressed relative to cells treated with DOX alone. (H) Images of SA-β-gal staining in control, DOX-treated, and DOX + metformin co-treated cells are shown in HUVECs. Images were analyzed and the percentage of SA-β-gal positive cells were calculated (n = 6–8). Values are presented as means ± SEM. Data were analyzed by one-way ANOVA followed by a Dunnet’s multiple comparisons test (Figures 1B,D,F–H) or non-parametric Kruskal–Wallis tests followed by Dunn’s post hoc test (Figures 1C, E); * p < 0.05, ** p < 0.01, *** p < 0.001, **** p < 0.0001. Schematic diagram created with BioRender.com.

