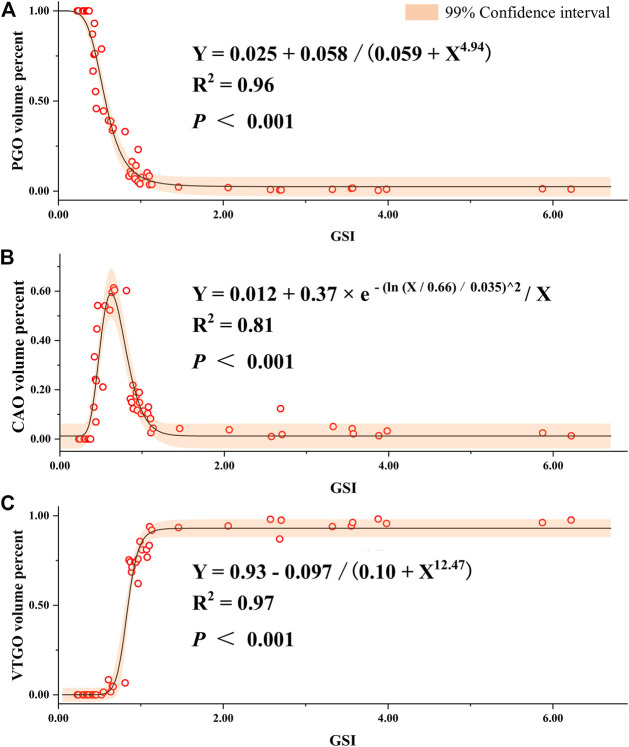
FIGURE 9.
Regression of gonadosomatic index (GSI) and volume percent of different development stages of oocytes in largemouth bass. (A) Regression between the GSI and volume percent of PGO (primary growth stage oocytes) relative to the total volume of all oocytes. (B) Regression between the GSI and volume percent of CAO (cortical alveoli stage oocytes). (C) Regression between the GSI and volume percent of VTGO (vitellogenesis stage oocytes). Oocytes were regarded as an oblate ellipsoid, and the volumes were calculated using the following formula: oocyte volume = πab2/6, where a and b are the long and short axes of oocytes, respectively (Shen et al., 2017; Hussein et al., 2020). To represent the volume percent of different stages of oocytes, at least six glass slides were made, and three slides of ovarian samples for each fish were measured. The number of female individuals for the regression is 55, which covers different development stages and ages (1–24 months).

