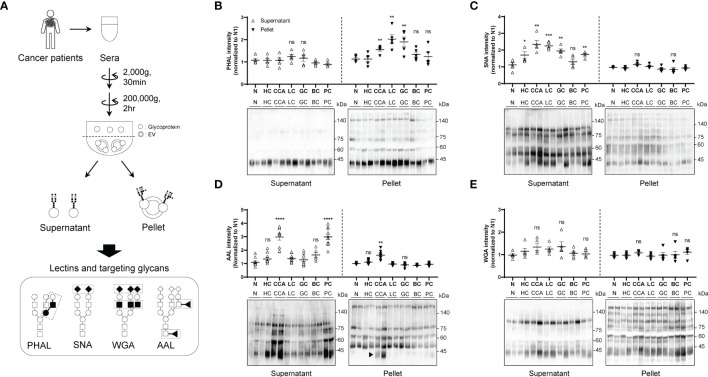
Figure 1.
Comparison of glycosylation between soluble and membrane-bound fraction in the serum of different cancers. Quantitative data are shown as mean ± S.E.M. Statistical analysis was performed using the two-tailed Student’s t-test. ****p < 0.0001, ***p < 0.001, **p < 0.01, *p < 0.05, ns p > 0.05. (A) Schematic illustration of glycosylation comparison between soluble fraction and membrane-bound fraction. ◼: GlcNAc, ●: mannose, ○: galactose, ▲: fucose, ◆: sialic acid. (B) PHAL blotting for different fractions in the sera from different cancers; n = 5. CCA, cholangiocarcinoma; HC, hepatocellular carcinoma; LC, lung adenocarcinoma; GC, gastric adenocarcinoma; BC, breast ductal carcinoma; PC, prostatic adenocarcinoma. (C) SNA blotting for different fractions in the sera from different cancers; n = 5. (D) AAL blotting for different fractions in the sera from different cancers; n = 5. (E) WGA blotting for different fractions in the sera from different cancers; n = 5. ns, not significant.

