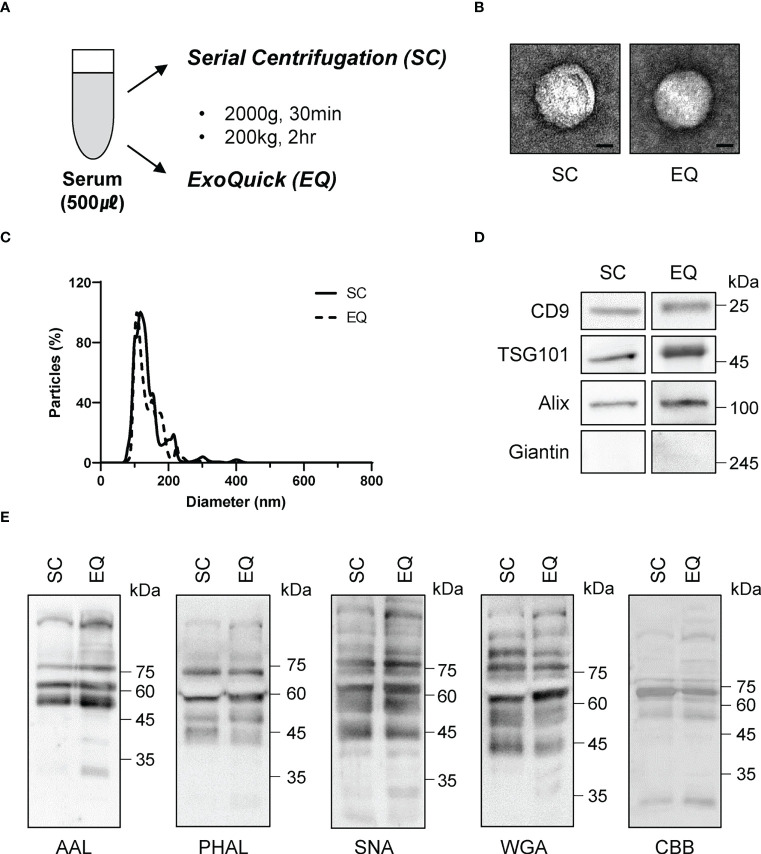
Figure 6.
Comparison of glycosylation between EVs isolated via two different approaches. (A) Schematic of the EV isolation methods. SC, serial centrifugation. EQ, ExoQuick. (B) Electron microscopy (EM) assessment of the size and morphology of isolated EVs. Representative images are shown. Scale bar = 20 nm. (C) Nanoparticle tracking analysis for the quantitation of EV size. (D) Western blotting using antibodies against EV components. n = 3. (E) Lectin blot assessing the glycosylation profiles of isolated EVs. The blotted membrane was stained with Coomassie Brilliant Blue, n = 3.

