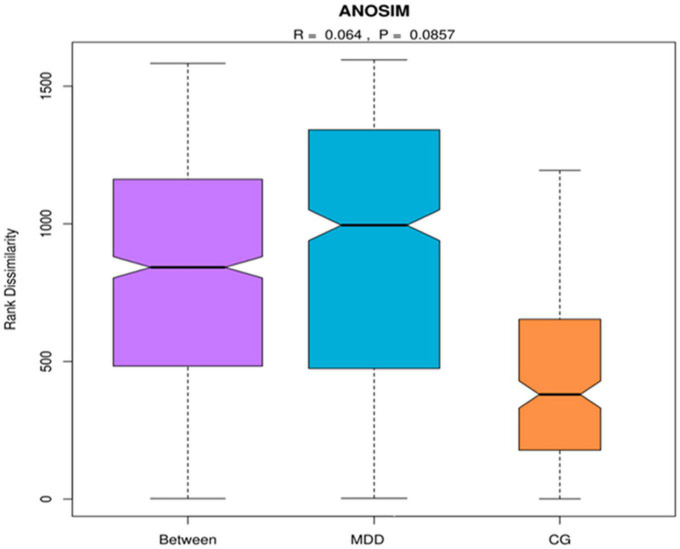
FIGURE 1.
Analysis of similarities. MDD group refers to the major depressive disorder group, and C group refers to the healthy control group. When R ∈ (–1, 1) and R > 0, there was a significant inter-group difference, and when R < 0, the intra-group difference was higher than the inter-group difference.

