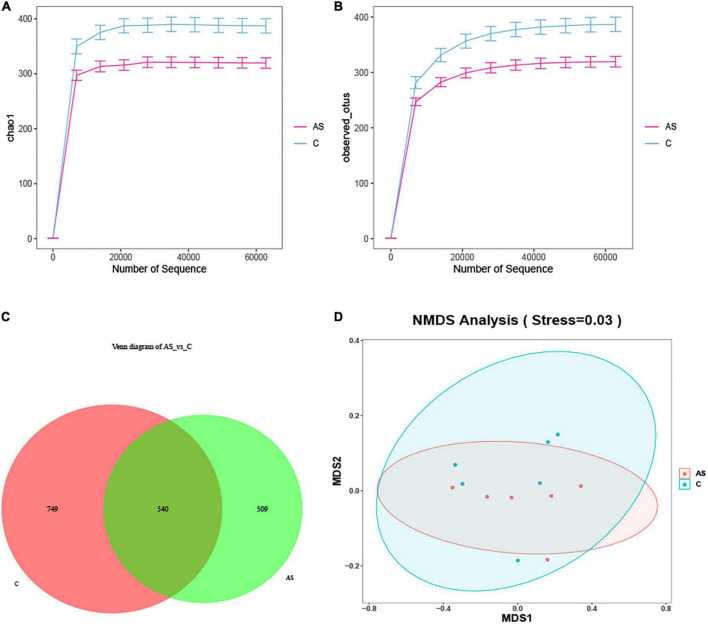
FIGURE 5.
Changes in the intestinal microbiota in carp after arsenic (As) exposure. (A) Chao sparsity curve. (B) Sparse curves of operational taxonomic units (OTUs). (C) Venn diagram. (D) Multidimensional scaling (NMDS) of fecal microbiota differences between the healthy fish and the As-treated fish.

