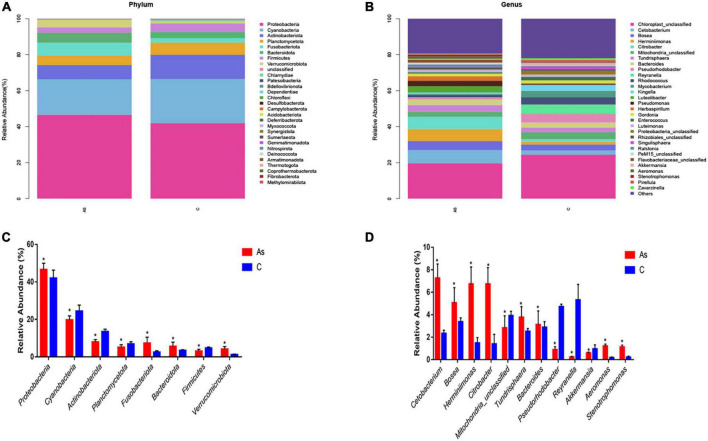
FIGURE 6.
Relative abundance and differences in the intestinal flora at the phylum and genus levels. (A,B) Relative abundance and differences at the phylum level, respectively. (C,D) Relative abundance and differences at the genus level, respectively. *P < 0.05 indicates a significant difference between the two groups.

