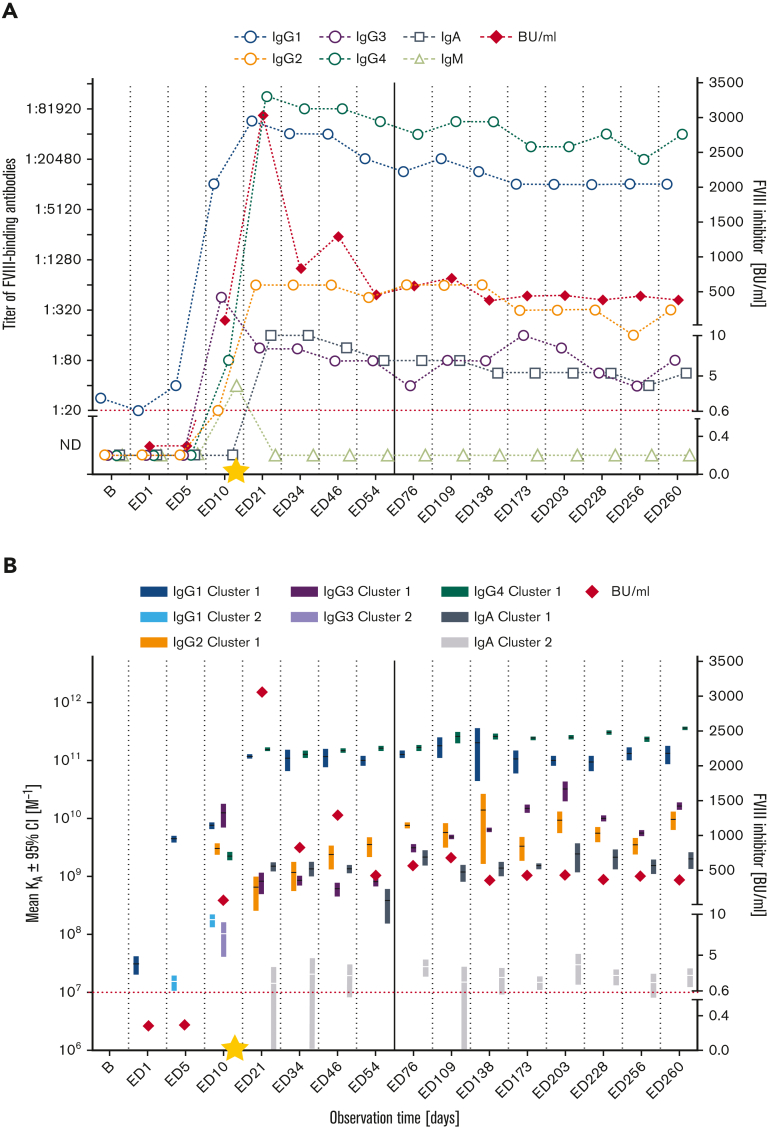
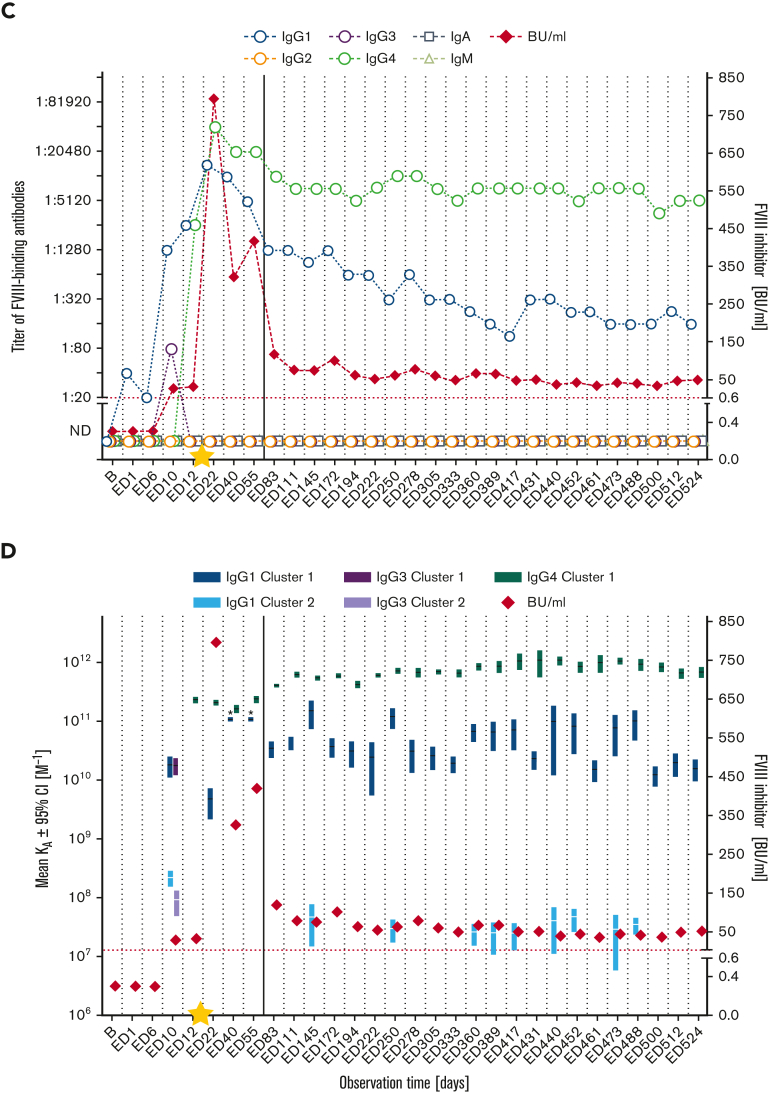
Figure 3.
Longitudinal monitoring of FVIII-specific antibodies and FVIII inhibitors in HIPS-ITI patients 3 and 4 during HIPS and HIPS-ITI. (A,C) FVIII-specific antibody titers (IgG1, IgG2, IgG3, IgG4, IgA, IgM as indicated) and FVIII inhibitors (BU/mL) for HIPS-ITI patients 3 (A) and 4 (C). The red dotted line represents the limit for positive evaluation of FVIII inhibitors (0.6 BU/mL). The yellow star marks the initiation of ITI treatment at ED12 (HIPS-ITI patient 3) and ED13 (HIPS-ITI patient 4). The continuous vertical line indicates the end of HIPS and the start of HIPS-ITI. (B,D) Mean KA for FVIII-specific antibodies differentiated for individual IgG subclasses/Ig isotypes and FVIII inhibitors (BU/mL) for HIPS-ITI patients 3 (B) and 4 (D). Data for apparent KAs include the 95% CIs for up to 2 affinity clusters for each IgG subclass and for IgA (dark colors: cluster 1; light colors: cluster 2). The red dotted line represents the limit for positive evaluation of FVIII inhibitors (0.6 BU/mL). The asterisks mark antibodies with apparent affinities that were too high (KAs > 1011 M−1) to be assessed. Therefore, their apparent KAs were reported as 1011 M−1. The yellow star marks the initiation of ITI treatment at ED12 (HIPS-ITI patient 3) and ED13 (HIPS-ITI patient 4). The continuous vertical line indicates the end of HIPS and the start of HIPS-ITI. ∗IgG1 cluster 1.


