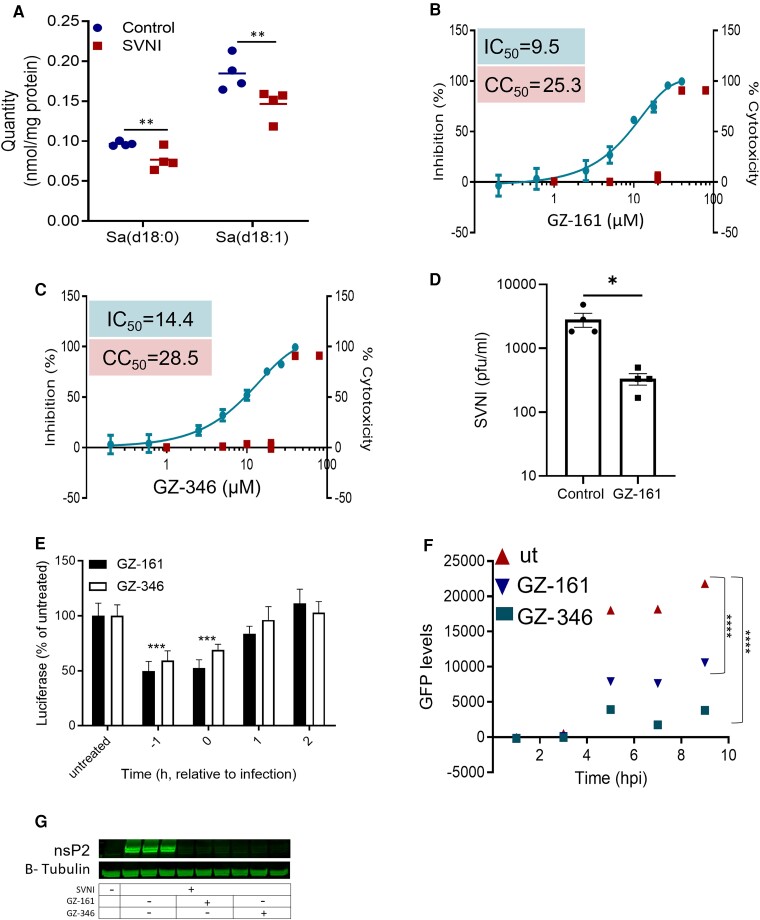
Figure 1.
Inhibition of SVNI by UGCG inhibitors. (A) Reduced levels of Sa d18:0 and Sa d18:1 3 h after SVNI infection. Vero cells were infected with SVNI (MOI = 5), and the SL levels were quantified by UPLC-MRM/MS at 3 hpi (dataset in Supplementary Table 1). The data are the means ± SEMs of four biological replicates. Statistical analysis was performed by one-way ANOVA with Tukey’s post hoc test (α = 0.05). **P < 0.01. (B, C) Dose–response curves of GZ-161 (B) and GZ-346 (C) on inhibiting infection with recombinant neuroadapted SV expressing luciferase (i.e. TRNSV-Luc). Vero cells were treated with GZ-161 or GZ-346 (0.2–80 µM) and infected 1 h later with TRNSV-Luc (MOI = 0.01). The infected cells were lysed 24 h later, and the luciferase activities were measured. The viability of the uninfected cells was determined by an XTT assay. Measurements were obtained from distinct samples. The data are the means ± SEMs of quadruplicates. The IC50 values of GZ-161 and GZ-346 were 9.5 and 14.4 µM, respectively. (D) Reduced SVNI release after treatment with GZ-161. Vero cells were treated with GZ-161 (10 µM). One hour later, the cells were infected with SVNI (MOI = 5). Viral release into the media was measured by plaque forming unit (PFU) assay at 24 h post infection. The data are the means of four replicates ± SEMs. Each data point represents the PFUs/ml in a single well. The statistical analysis was performed using a two-tailed unpaired t test. * P < 0.05. (E) Time-of-drug-addition assay. Vero cells were treated with 10 µM GZ-161 or GZ-346 1 h prior to infection (−1), immediately postinfection (0) and at 1 hpi (1) or 2 hpi (2). The cells were infected with TRNSV-Luc (MOI = 0.01) on ice for 1 h after washing. The infected cells were lysed 24 h later, and the luciferase activity was measured. Measurements were obtained from distinct samples. The data are the means ± SEMs of 12 replicates. The statistical analysis was performed by two-way ANOVA with Dunnett’s post hoc test (α = 0.05). ***P < 0.001 versus the infected untreated group. (F) Inhibition of subgenomic GFP expression by UGCG inhibitors. Vero cells were treated with 10 µM GZ-161 or GZ-346 1 h prior to infection. The cells were infected with SIN-GFP (MOI = 5) on ice for 1 h after washing. The GFP levels were measured repeatedly in a microplate reader at the indicated time points after infection. The data are the means ± SEMs of 16 replicates. The statistical analysis was performed by one-way ANOVA with Dunnett’s post hoc test (α = 0.05). ****P < 0.0001 versus the infected untreated group. (G) Reduced levels of the SVNI nonstructural protein nsP2 in UGCG inhibitor-treated cells at 4 hpi as determined by Western blotting. Vero cells were infected with SVNI (MOI = 5) in the presence of GZ-161 (10 µM) or GZ-346 (10 µM) or were left untreated (UT). UGCG inhibitors were added to the media 1 h before infection. Tubulin protein was used as the loading control. Triplicates from distinct samples are presented. Uncropped blots are shown in Supplementary Fig. 7.

